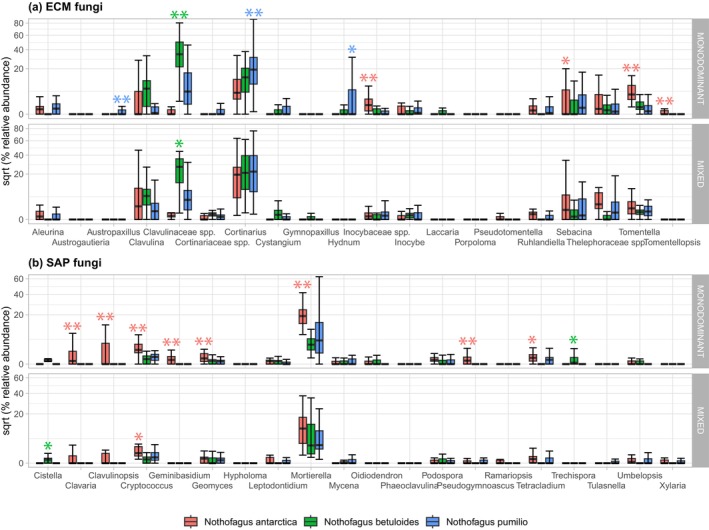
FIGURE 2.

Relative abundance of (a) ectomycorrhizal (ECM) and (b) saprotrophic (SAP) fungal genera and families beneath each Nothofagus host, in monodominant and mixed forests. Square root transformation was applied to the graph to enhance visibility. Positive associations with a Nothofagus species based on point biserial correlation coefficients (Table S1) are indicated above the bars, with significance level as * ≤ .05, ** ≤ .01, adjusted using the Benjamin & Hochberg correction. Only the 20 ECM and SAP fungal groups with the highest relative abundance are shown here.
