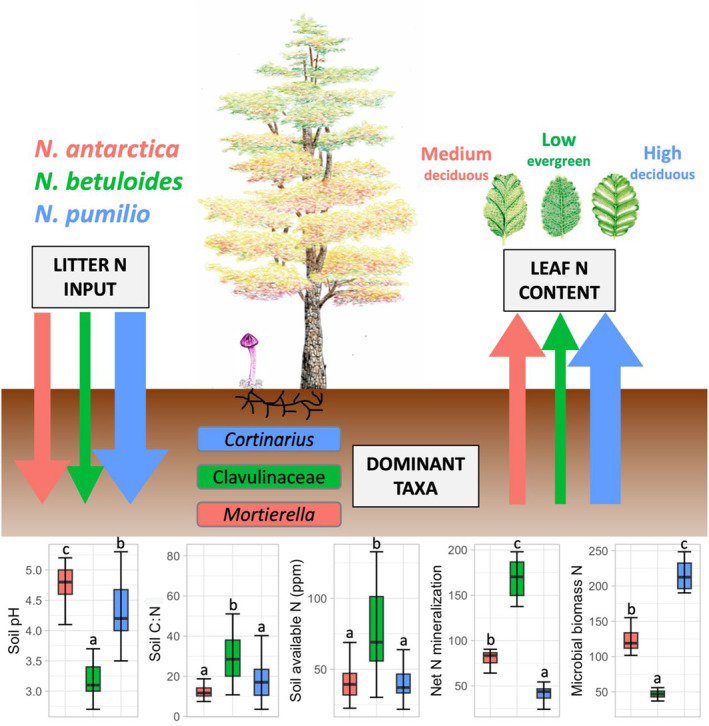
FIGURE 4.

The nitrogen (N) economy in monodominant Nothofagus forests of Tierra del Fuego: Arrows represents hypothetical N fluxes color‐coded by Nothofagus species, based on N litter input and N leaf content according to previous studies (Diehl et al., 2008; Moretto & Martínez Pastur, 2014; Romanyà et al., 2005) Edaphic variables are represented as boxplots, with Tukey HSD post‐hoc tests (p‐values ≤.05) indicated with bold letters, based on generalized linear models with a Gamma distribution, as in Table 1. Despite a lower N leaf content and litter N input, N availability was significantly higher in evergreen N. betuloides forests (in green), suggesting a tight inorganic N cycle with higher relative abundance of ECM taxa (Clavulinaceae) adapted to low soil pH and poor drainage. In comparison, N availability was significantly lower in deciduous N. pumilio forests (in blue), despite higher N leaf content and litter N input; significantly higher N microbial biomass and relative abundance of ECM fungi with SOM decay abilities (Cortinarius) suggest an organic N economy where N is primarily stored in ECM mycelial biomass. Soils in deciduous N. antarctica forests (in red) showed intermediate levels of N availability and a higher relative abundance of saprotrophic fungi (Mortierella), likely promoted by understory grassland vegetation. Illustrations © PameFagus (Pamela Ciudad Martin).
