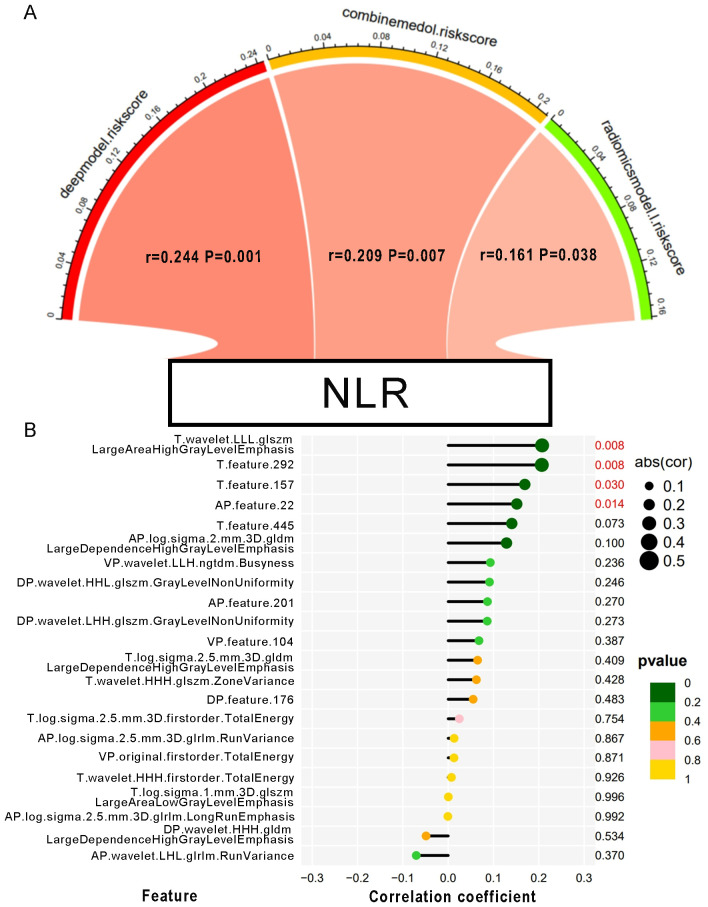
Figure 4.
The correlation between the NLR and MRI features. (A) Pearson correlation between NLR and the risk scores of each predictive model. The color of the band represented the R-value. (B) Correlation of the NLR with every single MVI-related MRI feature. The size of the circle represents the magnitude of the correlation coefficient. The color of the circle indicates the magnitude of the p-value.

