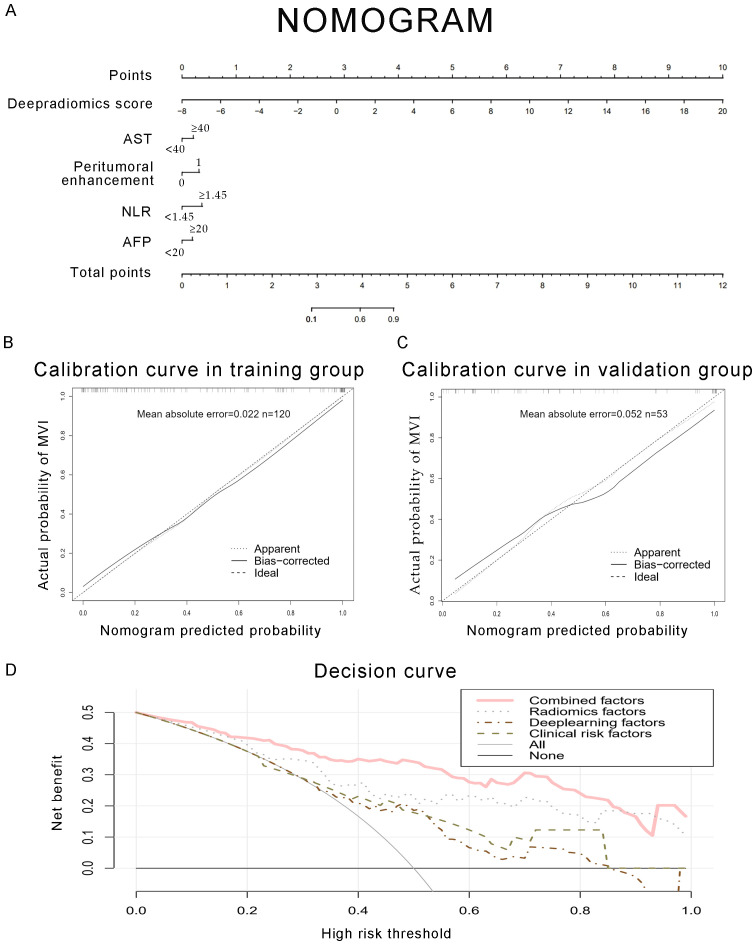
Figure 6.
Development of a predictive nomogram for assessing the probabilities of MVI, along with calibration and decision curves. (A) A nomogram combining fusion radiomics-deep risk score, inflammation markers (NLR, AST), serum AFP, and radiological factor (peritumoral enhancement). (B, C) Calibration curves of the nomogram in the training and validation groups. The X-axis is the nomogram-predicted probability of MVI. The Y-axis is the actual probability of MVI. (D) Decision curve of the nomogram for predicting MVI. The pink line represents the expected net benefit per patient derived from the predictive nomogram.

