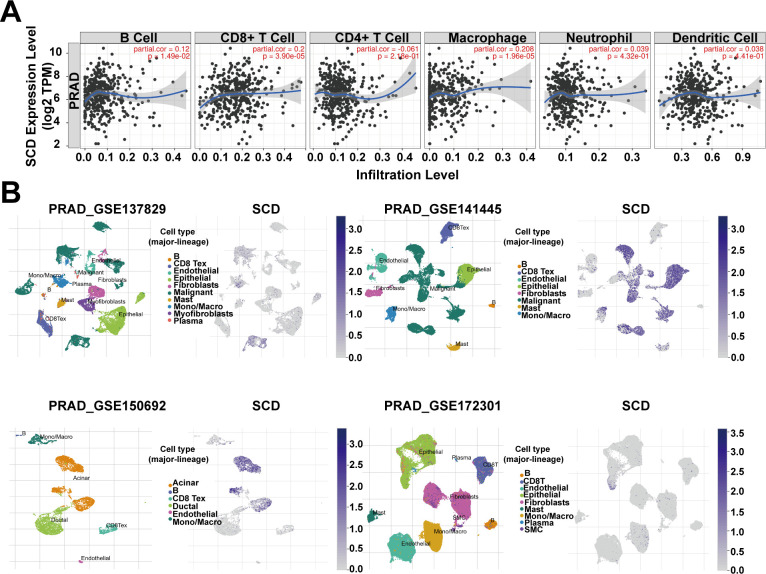
Figure 4.
SCD expression in tumor microenvironment. (A) Relationship between the SCD expression and immune cell infiltration in PRAD using the TIMER tool. Spearman’s correlation was used to perform this association analysis. (B) SCD expression at single-cell resolution in different PRAD datasets from TISCH database.

