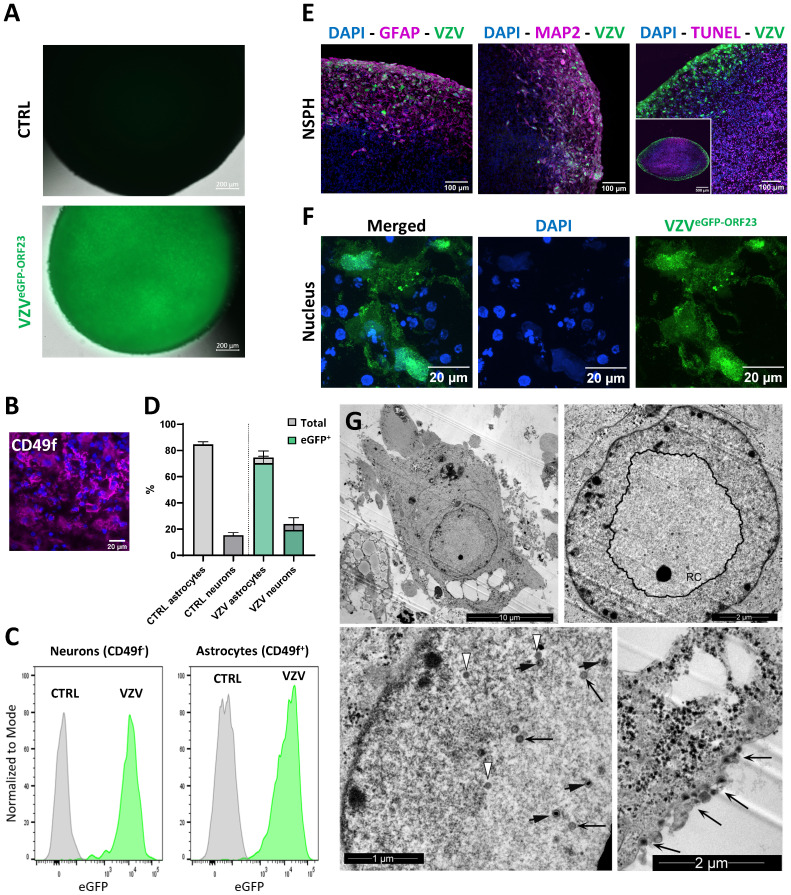
Figure 2.
VZVeGFP-ORF23 infection of 5-month-old NSPHs. (A) Representative live cell fluorescence image of uninfected NSPHs and VZVeGFP-ORF23 infected NSPHs at day 7 post-infection. Scale bars of 200 µm are indicated on the images. (B) Representative image of a NSPH stained with the extracellular astrocyte-enriched CD49f marker (magenta) and nuclei labelled with DAPI (blue). Scale bar of 20µm indicated on the image. (C) Representative flow cytometric analysis showing histogram overlay of CD49f- neurons and CD49f+ astrocytes obtained from dissociated uninfected NSPHs (CTRL) and VZVeGFP-ORF23 infected NSPHs (VZV) at day 7 post-infection. (D) Bar graph indicating the average percentage of astrocytes and neurons measured in uninfected NSPHs (CTRL) and VZVeGFP-ORF23 infected NSPHs (VZV), as well as the average % of astrocytes and neurons displaying eGFP-ORF23 fluorescence in VZVeGFP-ORF23 infected NSPHs (n=3 for CTRL and n=3 for VZV). Error bars indicate standard deviation (SD). (E) Representative images of VZVeGFP-ORF23 infected NSPHs (green) at the age of 5 months immunolabelled for GFAP (magenta), MAP2 (magenta) and TUNEL (magenta), as indicated. Nuclei are labelled with DAPI (blue). Scale bars of 100 and 500 µm are indicated on the images. (F) Representative images of the cytoplasmic and nuclear localisation of VZVeGFP-ORF23 (green) in infected NSPHs at the age of 5 months. Nuclei are labelled with DAPI (blue). Scale bars of 20 µm are indicated on the images. (G) Representative transmission electron microscopy (TEM) images of VZVeGFP-ORF23 infected NSPHs at the age of 5 months. Upper left image showing an overview TEM image of a VZVeGFP-ORF23 infected cell. Upper right image showing the nuclear replication complex (RC). Lower left image showing different maturation stages of the VZV virion, with white arrows indicating procapsids, long black arrows indicating capsid B and short black arrows indicating capsid C Lower right image showing viral particles egressing at the cell surface (long black arrows). Scale bars of 1, 2 and 10 µm are indicated on the images.

