Figure 3.
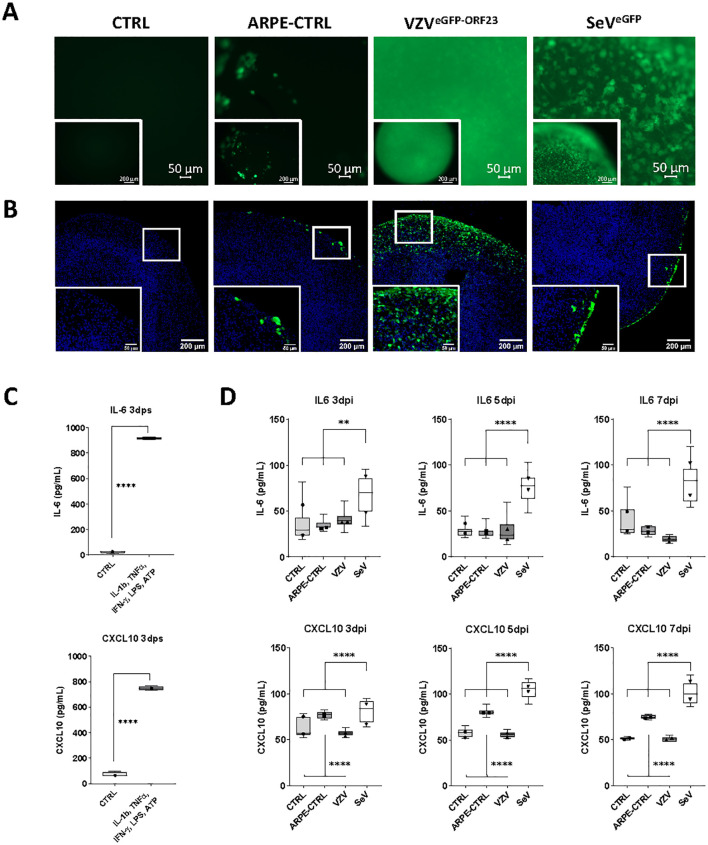
Immune responsiveness of VZVeGFP-ORF23- and SeVeGFP-infected NSPHs. (A) Representative live cell fluorescence image of 5-month-old control NSPHs (CTRL), NSPHs inoculated with eGFP+ control ARPE19 cells (ARPE-CTRL, green), NSPHs inoculated with VZVeGFP-ORF23-infected ARPE19 cells (VZVeGFP-ORF23, green), and NSPHs infected with SeVeGFP (SeVeGFP, green) at day 7. Scale bars of 50 and 200 µm are indicated on the images. (B) Representative images of 5-month-old control NSPHs (CTRL), NSPHs inoculated with eGFP+ control ARPE19 cells (ARPE-CTRL, green), NSPHs inoculated with VZVeGFP-ORF23-infected ARPE19 cells (VZVeGFP-ORF23, green), and NSPHs infected with SeVeGFP (SeVeGFP, green) at day 7. Nuclei are labelled with DAPI (blue). Scale bars of 50 and 200 µm are indicated on the images. (C) Boxplots showing IL-6 and CXCL10 cytokine secretion (in pg/mL) by 5-month-old control NSPHs (CTRL, n=4) and NSPHs stimulated with IL-1b, TNF-α, IFN-γ, LPS and ATP (n=4) at day 3 post-stimulation (dps). **** p<0,0001. Error bars indicate standard deviation (SD). (D) Combined box/dotplots showing IL-6 and CXCL10 cytokine secretion (in pg/mL) derived from 2 independent experiments for5-month-old control NSPHs (CTRL, n=8 for Exp1, n=4 for Exp 2), NSPHs inoculated with eGFP+ control ARPE19 cells (ARPE-CTRL, n=8 for Exp1, n=4 for Exp 2), NSPHs inoculated with VZVeGFP-ORF23-infected ARPE19 cells (VZV, n=8 for Exp1, n=4 for Exp 2), and NSPHs infected with SeVeGFP (SeV, n=8 for Exp1, n=4 for Exp 2) at 3-, 5- and 7-days post-infection (dpi). The mean of each individual experiment is given as a dot within the boxplot. ** p<0,01. **** p<0,0001.

