Figure 5.
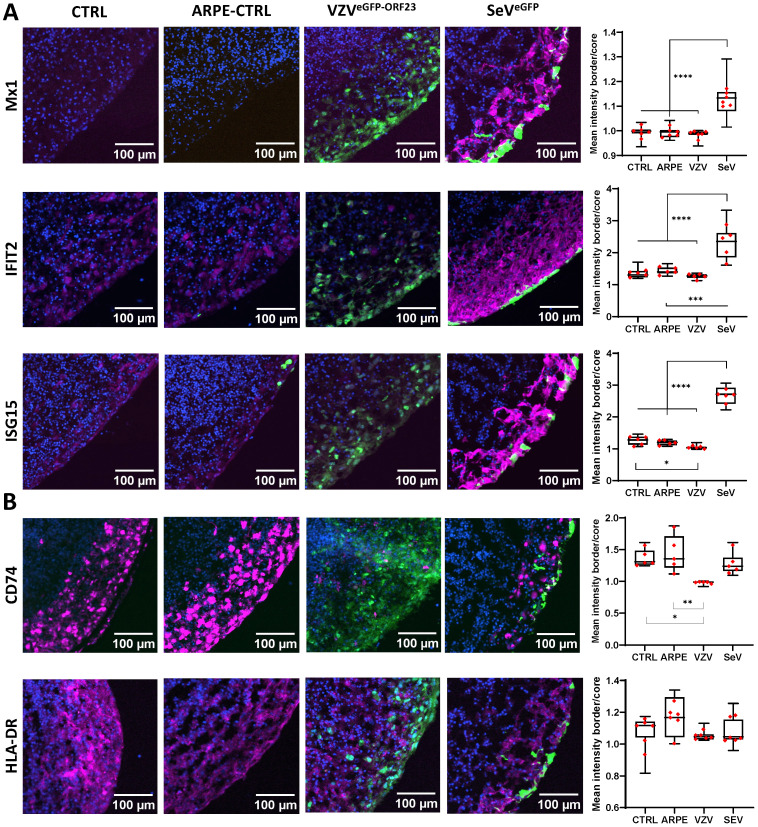
VZVeGFP-ORF23 and SeVeGFP-infected NSPHs display opposite effects on protein expression related to Type-I interferon response and antigen presentation pathway. Representative immunofluorescence images for 5-month-old control NSPHs (CTRL, n=6), NSPHs inoculated with eGFP+ control ARPE19 cells (ARPE-CTRL, green, n=6), NSPHs inoculated with VZVeGFP-ORF23-infected ARPE19 cells (VZVeGFP-ORF23, green, n=6), and NSPHs infected with SeVeGFP (SeVeGFP, green, n=6), immunolabelled for (A) Type-I interferon response markers MX1, IFIT2 and ISG15, and (B) antigen presentation pathway markers HLA-DR and CD74. All in magenta. Nuclei are labelled with DAPI (blue). Scale bars of 100 µm are indicated on the images. Combined box/dotplots showing signal quantification. The mean value for each individual NSPH analysed is given as a dot within the boxplot. * p<0,05. ** p<0,01. *** p<0,001. **** p<0,0001.

