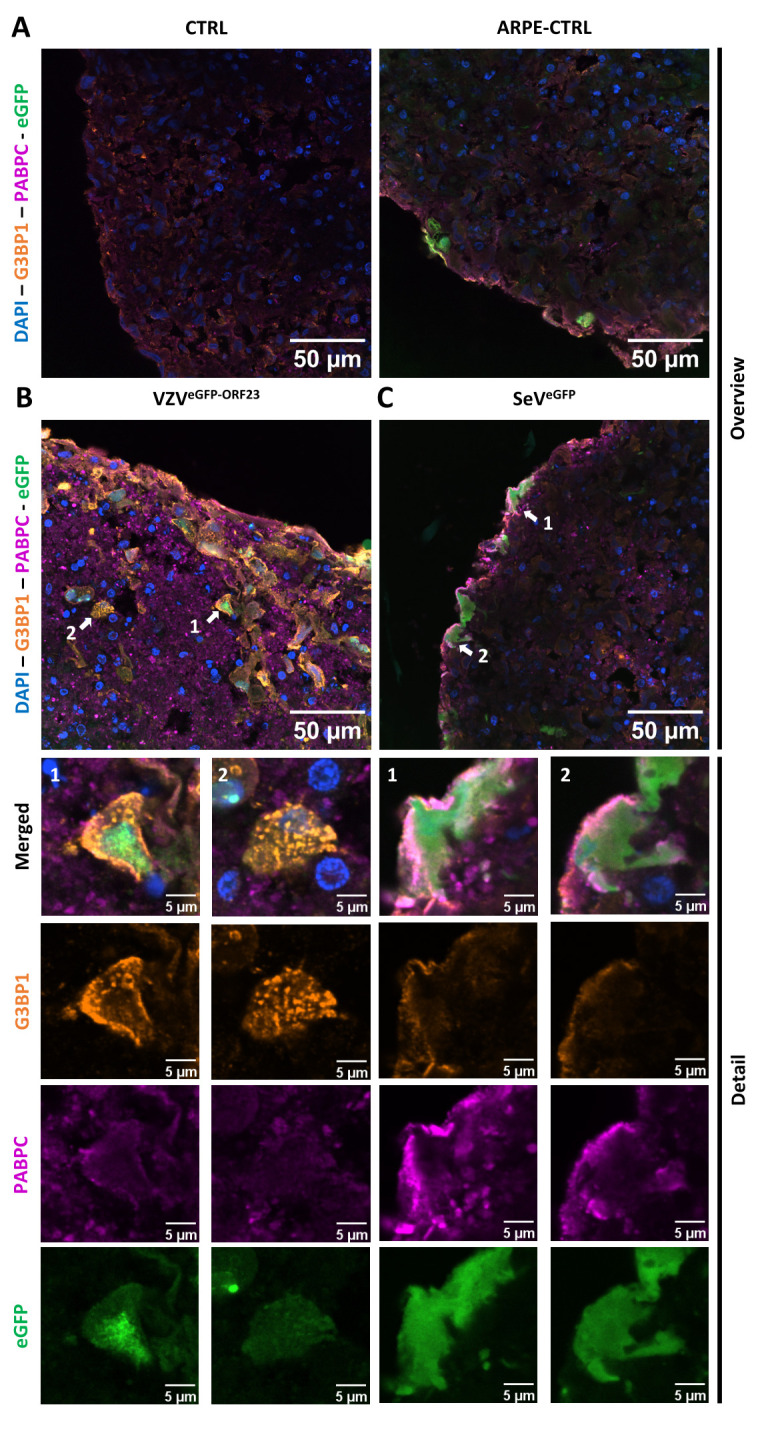
Figure 6.

Formation of stress granules in VZVeGFP-ORF23 and SeVeGFP-infected NSPHs. Representative overview immunofluorescence images of control NSPHs [(A), top left], NSPHs inoculated with eGFP+ control ARPE19 cells [(A), top right, ARPE-CTRL], NSPHs inoculated with VZVeGFP-ORF23-infected ARPE19 cells [(B), top left, VZVeGFP-ORF23], and NSPHs infected with SeVeGFP [(C), top right, SeVeGFP], immunolabelled for G3BP1 (orange) and PABPC1 (magenta). Insets of virus-infected cells are depicted by white arrows on the overview image [(B, C), top] and shown below the corresponding overview images [(B, C), bottom]. Nuclei are labelled with DAPI (blue). Scale bars of 50 (overview) and 5 (detail) µm are indicated on the images.
