. 2024 Feb 14;42(4):749–761. doi: 10.5534/wjmh.230239

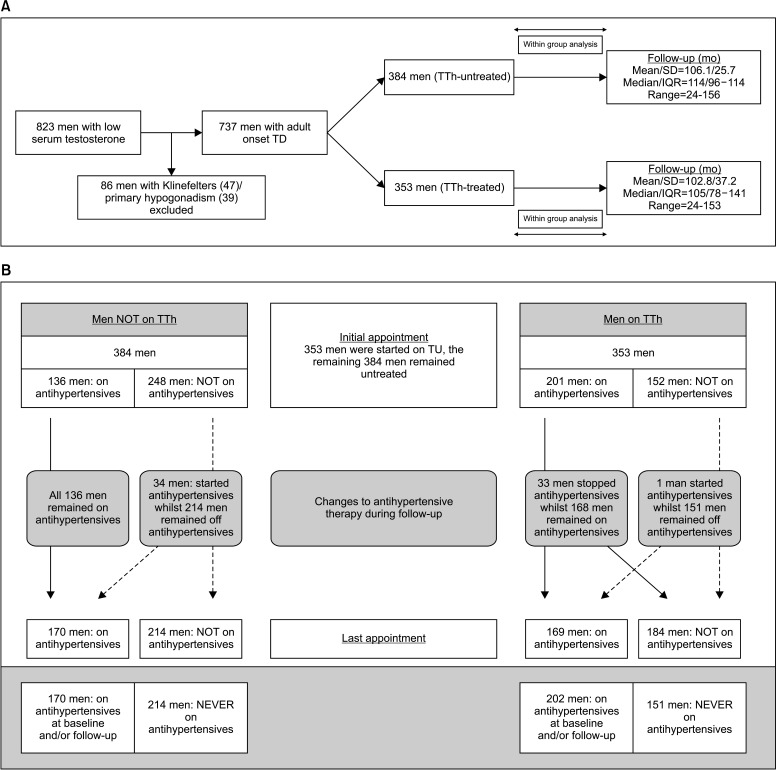
Fig. 1. Baseline characteristics and flow charts demonstrating the cohort stratified into groups used in the statistical analyses. (A) A flow chart of the study groups and their baseline characteristics. All the data are in accordance with the STROBE statement (https://www.equator-network.org/wp-content/uploads/2015/10/STROBE_checklist_v4_cohort.pdf). Data on patients on/never on antihypertensive agents are provided in Table 1. (B) A flow chart of TTh and antihypertensive treatments at baseline, during follow-up and at the last visit. TD: testosterone deficiency, TTh: testosterone therapy, SD: standard deviation, IQR: interquartile range, TU: testosterone undecanoate.

Fig. 1