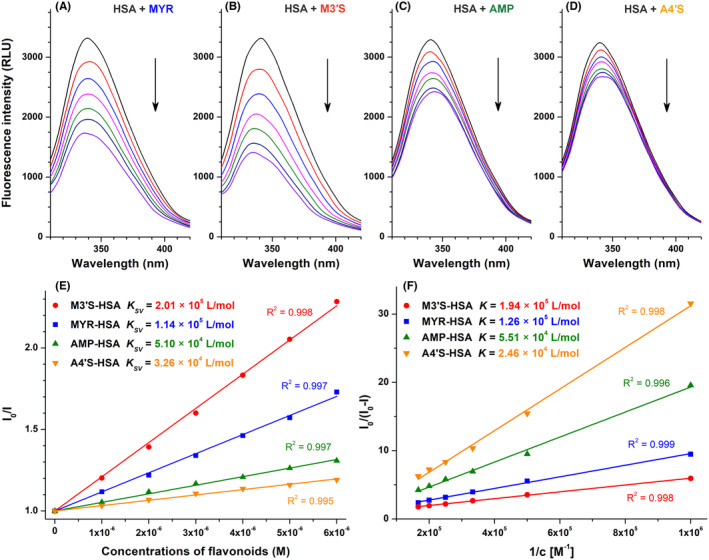
FIGURE 2.

Representative fluorescence emission spectra of HSA (2 μM) in the presence of increasing concentrations (0–6 μM) of MYR (A), M3′S (B), AMP (C), and A4′S (D) in PBS (pH 7.4). Stern–Volmer plots (E) and modified Stern–Volmer plots (F) of flavonoid‐HSA complexes (λex = 295 nm, λem = 340 nm).
