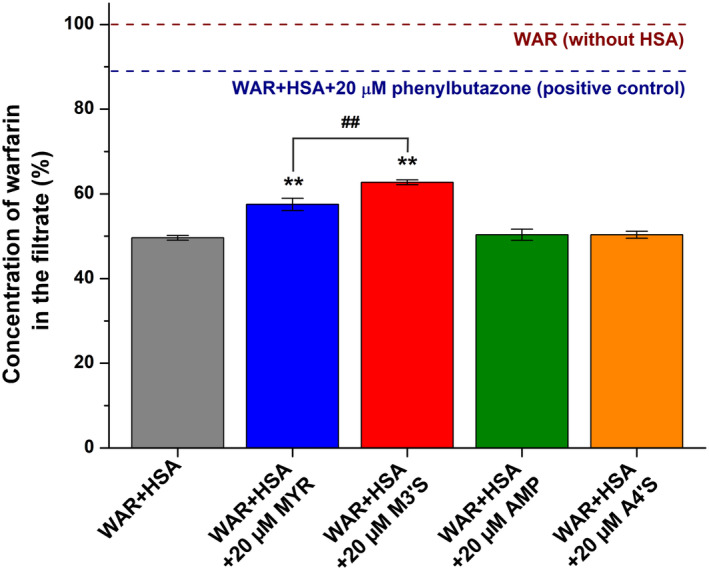
FIGURE 3.

Effects of MYR, M3′S, AMP, and A4′S on the filtered fraction of warfarin. Samples, containing warfarin (1.0 μM) and HSA (5.0 μM) in the absence and presence of flavonoids (20 μM) in PBS (pH 7.4), were filtered through the filter units (molecular weight cut‐off = 30 kDa; **p < .01: compared to WAR+HSA; ## p < .01: effects of M3′S compared to MYR). Warfarin (1.0 μM) filtered without HSA (100%; brown) and the impact of the positive control phenylbutazone (20 μM; navy blue) were marked with dashed lines.
