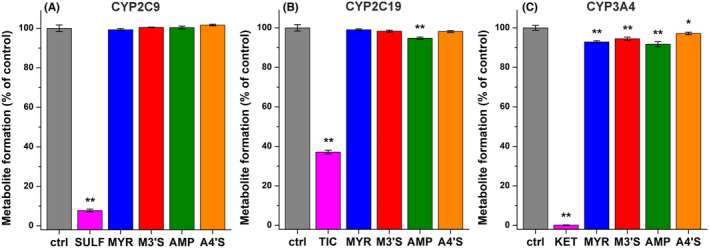
FIGURE 4.

Effects of MYR (blue), M3′S (red), AMP (green), and A4′S (orange) on CYP2C9 (A), CYP2C19 (B), and CYP3A4 (C) enzymes. Metabolite formation (% of control ± SEM) was examined in the absence and presence of the positive control inhibitors (20 μM; magenta) or flavonoids (20 μM) regarding CYP2C9‐catalyzed diclofenac hydroxylation, CYP2C19‐catalyzed (S)‐mephenytoin hydroxylation, and CYP3A4‐catalyzed testosterone hydroxylation (n = 3; substrate concentrations = 5 μM; *p < .05, **p < .01; SULF, sulfaphenazole; TIC, ticlopidine; KET, ketoconazole).
