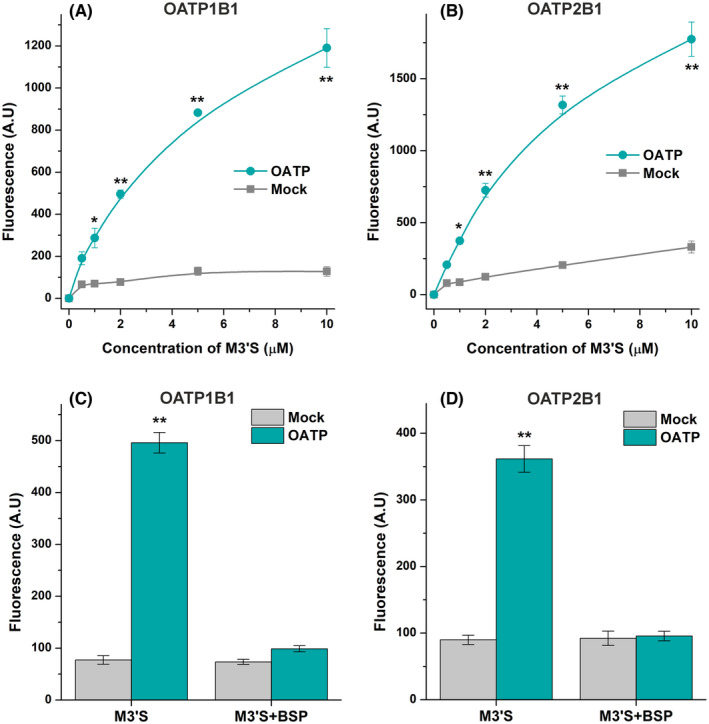
FIGURE 7.

Concentration‐dependent uptake of M3′S by A431 cells overexpressing OATP1B1 (A) or OATP2B1 (B) versus their mock‐transfected controls, and the effects of BSP (OATP inhibitor) on the uptake of M3′S by OATP1B1 (C) and OATP2B1 (D). Cells were incubated with M3′S for 2 min (OATP1B1; A) or 5 min (OATP2B1; B). The impacts of BSP on M3′S (2 μM) transport in A431‐OATP1B1 and A431‐OATP2B1 cells (and their mock controls) were determined after the incubation with or without BSP (20 μM) for 5 min (C, D). Cells were rinsed, then the fluorescence was determined after adding APB + BSA (see further experimental details in Section 2.8). The mean (± SEM) values demonstrated were obtained from three biological replicates (n = 3; *p < .05, **p < .01).
