

Summary
NGN2-driven induced pluripotent stem cell (iPSC)-to-neuron conversion is a popular method for human neurological disease modeling. In this study, we present a standardized approach for generating neurons utilizing clonal, targeted-engineered iPSC lines with defined reagents. We demonstrate consistent production of excitatory neurons at scale and long-term maintenance for at least 150 days. Temporal omics, electrophysiological, and morphological profiling indicate continued maturation to postnatal-like neurons. Quantitative characterizations through transcriptomic, imaging, and functional assays reveal coordinated actions of multiple pathways that drive neuronal maturation. We also show the expression of disease-related genes in these neurons to demonstrate the relevance of our protocol for modeling neurological disorders. Finally, we demonstrate efficient generation of NGN2-integrated iPSC lines. These workflows, profiling data, and functional characterizations enable the development of reproducible human in vitro models of neurological disorders.
Keyword(s): iPSC, NGN2, neuron maturation, disease modeling, neuronal differentiation, multi-omics profiling
Graphical abstract
Highlights
-
•
Optimized NGN2 protocol generates functional postnatal neurons in 28 days
-
•
Extensive profiling data provide benchmarks for neuron maturation
-
•
Maturation assays reliably assess neuron maturation in single or mixed cell types
-
•
Rapid targeted engineering protocol integrates NGN2 into iPSC lines in 3 weeks
Motivation
Using induced pluripotent stem cell (iPSC)-derived neurons (iNs) to model diseases requires defined, robust, and reproducible protocols capable of generating predictable neuronal types. In addition, extensive profiling is essential to assess whether iNs are suitable to model specific diseases with desired molecular, functional, and maturation-related features. We sought to establish a standardized protocol for generating iNs at large scales. We also sought to develop systematic profiling data and assays for determining the maturation levels of iN cultures as resources for the community.
Shan et al. report methods to generate postnatal-like iPSC-derived neurons at large scale and with long-term stability. They provide extensive characterization data and assays to measure neuronal maturity. They find genes associated with maturation exhibit diverse functions. Their data support the utility of these methods to enable modeling of neurological disorders.
Introduction
Induced pluripotent stem cell (iPSC)-derived neurons (iNs) are valuable tools for modeling human neurological disorders. Currently, two approaches are widely adopted to generate iNs. The classical directed-differentiation (DD) approach aims to recapitulate the known signaling cues of neurogenesis and can pinpoint specific regional identities of neurons. However, this method typically takes many weeks to generate committed and functional neurons1,2 and is technically demanding. Additionally, the differentiated cell populations often contain off-target populations of inhibitory neurons and astrocytes, whose proportions largely depend on the intrinsic properties of the iPSC line.3,4
More recently, transcription factor overexpression methods have gained popularity in rapidly generating cell types of interest.5 Overexpression of NEUROG2 (NGN2) was found to drive iPSCs into the excitatory neuronal fate within 1 week.6,7,8 Compared with DD, this method is much faster and requires less technical expertise.
Since the first published method,6 the NGN2 iN protocols have improved in reproducibility and target cell types. Early protocols use lentivirus to introduce the doxycycline (dox)-inducible NGN2 transgene,6 which has the potential to create genomic aberrancy and batch-to-batch variabilities. Furthermore, in large-scale screens, where billions of neurons are required, lentivirus may become a limiting factor of scale and facility accessibility. To overcome this issue, recent protocols adopted cell lines with the inducible NGN2 engineered into a safe-harbor site of iPSC lines.9,10,11 The clonality of cell lines reduces batch-to-batch variabilities.5 Subsequent improvements were made by incorporating DD factors during neural induction to achieve more homogeneous and targeted neuron types.8,12,13
Beyond neural induction, the iN maturation protocols can be further improved. Most protocols require co-culture with astrocytes to promote neuronal maturity and activity.6,7,8,11,13 This introduces variabilities and often negates the advantage of NGN2 protocols in generating a relatively homogeneous cell type. Additionally, co-culture with astrocytes adds complexity to downstream analyses.
In terms of profiling data, most published data focused on early NGN2 iNs (up to week 4 of differentiation). This can make it difficult to assess whether a protocol is suitable for studies requiring more mature neurons.
This insufficient understanding of iPSC-derived neuron maturation status is also due to the lack of well-established maturation markers and assays. Previous studies have used the expression levels of one or several genes to sort out mature iNs.8,12,14 These genes, although likely to be indicative of some aspects of neuronal maturation, may not encompass the entire concept of maturation, such as ion channel incorporation, cytoskeletal reorganization and cell-to-cell and cell-to-extracellular matrix (ECM) interactions.15
In this study, we incorporated the recent progress described above and tackled key remaining technical issues to generate long-term stable, glutamatergic NGN2 iN cultures at scale. We thoroughly profiled our cells up to day 56 to provide reference data. Using the profiling data, we developed neuronal maturation assays and established the suitability to use these NGN2 iNs to model neurological disorders. Finally, we report a protocol to engineer inducible NGN2 iPSC lines similar to the commercial lines used in this study. Together, this study offers powerful tools for developing robust in vitro models of neurological diseases.
Results
NGN2 iN protocol and cell identification
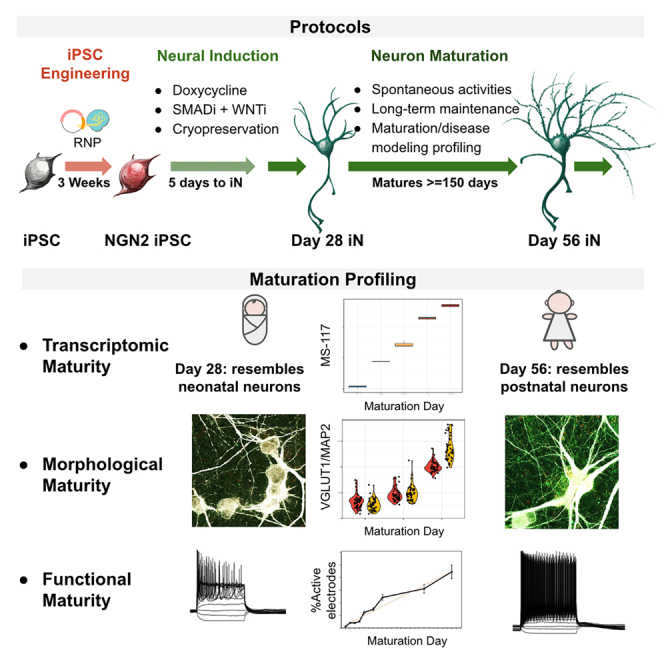
We optimized a DD-coupled NGN2 overexpression protocol to generate excitatory neurons based on previous methods8 (Figure 1A, protocol described in STAR Methods in detail). We opted for a commercially available inducible NGN2 iPSC line (iP11N) for its availability to the research community. The transgenes for dox-inducible NGN2 overexpression were engineered into the AAVS1 safe-harbor sites of iP11N, eliminating lentivirus-induced gene disruptions.16 We used a second line independently engineered from the same parental line (iNgn2-dCas9-KRAB-CloneG12, referred to as G12 hereinafter) to confirm the validity of the protocol. With this induction method, we observed neuronal morphology appearing on day 2, and most cells exhibited neuronal morphology by day 4 (Figure 1B).
Figure 1.

NGN2 neuron protocol overview
(A) Schematics for NGN2 iN protocol. Coating conditions, basal media, and various factors are illustrated. iPSCs were maintained in mTeSR Plus and iMatrix-511 for 2 weeks post thaw before being replated as single cells for neural induction. At day 5, young neurons were replated. Neurons were maintained in a defined medium (DM) for up to 150 days.
(B) Representative images of cell morphologies at key stages. Neuronal morphology emerges on day 2 (green arrows). Day 6, yellow arrows: remaining progenitors. Neurite density and thickness increased from day 14 onwards. ∗Day 150 neurons were plated at 50,000/cm2 instead of 150,000/cm2 for other cultures, to accommodate the specific experimental requirement. Scale bar, 200 μm. N (independent inductions) > 10.
(C) Immunofluorescent images identifying NGN2 iNs generated in this protocol as CUX1, CUX2-positive, GABA-negative neurons. See also Figure S1E. Scale bar, 200 μm. N (independent cultures) = 3.
Importantly, we optimized conditions that promote clump-free and long-lasting neuron cultures. We tested plating and replating cell densities, coating conditions, and the effects of various small molecules (Figures S1A–S1C). We found the initial plating density of 40,000/cm2 produces a good yield of neurons for both iP11N and G12 (typically between 120,000/cm2 and 200,000/cm2). Doxycycline (Dox) at 3 μg/mL provides optimal induction efficiency with low toxicity (Figure S1A). We found that Noggin performed better in neuronal induction and morphology than the more economical alternative LDN-193189 (Figure S1B). During replating, eliminating Rho-kinase inhibitors while including anti-proliferative agents inhibited the formation of clumps in cultures. Further imaging studies confirmed that clumps were typically caused by niche-forming progenitor cells (Figure S1C; Video S1), consistent with previous observations.17 In addition to AraC (Cytarabine), we found that mitomycin-C (MMC) at 0.25 μM and fluorouracil (5-FU) at 60 μM were similarly effective (Figure S1C, top row). Lastly, including the Notch inhibitor DAPT in both induction and replating media produced the most consistent, clump-free culture (Figure S1D). With this method, we were able to maintain healthy mono-layer cultures for at least 5 months (Figure 1B, day 150).
We also explored conditions suitable to generate large batches of NGN2 iNs and cryopreserve for later use. Cryopreservation at induction day 5 yields cells with survival rates over 85% post thaw without generating large amounts of neurite debris. This allowed routine NGN2 inductions in T500 flasks with a yield of 100–150 million cells per flask.
To characterize the identity of the NGN2 iNs, we performed immunofluorescence (IF) at day 28 of differentiation (Figure 1C). Consistent with most other published NGN2 iN profiling data,18 these iNs were CUX1, CUX2 positive (Figure 1C); CTIP2, TBR1 negative (Figure S1E); and FOXG1 negative (Figure S1E). We also did not observe any inhibitory neurons identified by GABA IF (Figure 1C). These data indicate that our NGN2 iNs resemble excitatory neurons but lack key telencephalic features marked by FOXG1.
NGN2 iN protocol robustly generates glutamatergic neurons
To further understand the reproducibility and heterogeneity of neuron identity, we performed single-nuclei RNA sequencing (snRNA-seq) on two independent batches of day 28 NGN2 iNs, each using iP11N and G12 iPSC lines. Among the clusters of mature neurons, five can be separated by the expression levels of GPM6A, ISL1, TAC1, and HCN1 (Figures 2A, 2B, and S2A). Most cells were GPM6A+ (75.8%, Figure 2A blue, light blue, and pink), co-expressing CUX1 and SLC17A6, a CNS feature. A minority were GPM6A− (22.9%, Figure 2A greens) with PRPH+ cells sparsely distributed (Figure S2B), indicating peripheral nervous system (PNS) features. A cluster of GPM6A+ cells expressed TAC1, a subcortical and sensory neuron marker (Figure S2A). These features are similar to recent publications that concluded that NGN2 iNs exhibit mixed CNS and sensory neuron features.13,18 Lastly, an immature cluster was identified by neural progenitor markers VIM and TOP2A (1.3% of total cells, Figure 2A, red; Figure S2A).
Figure 2.

NGN2 iNs cell identities, heterogeneity, and protocol reproducibility
(A) Uniform manifold approximation and projection (UMAP) presentation of cell clusters identified by single-nuclei RNA-seq (snRNA-seq) in day-28 NGN2 iNs. Six clusters were identified. N = 4 with two cell lines and two technical replicates each.
(B) Quantification of the percentage and average expression of each marker in each identified cluster shown in (A). Shade: scaled expression. Size: percentage of cells expressing the gene.
(C) Sample-cluster relationships separated by replicates and cell lines. Top, UMAP distribution of cells generated in each replicate. Bottom: percentage of cells in each cluster, separated by sample.
The SLC17A6-high, SLC17A7-low pattern in the NGN2 iNs suggests thalamic neuronal features. Indeed, we found thalamic marker genes NTNG1, CD47, and TCF7L2 in NGN2 iNs (Figure S2B, third row), while cortical markers POU3F2 and STAB2 were more sparsely distributed (Figure S2B, row 2).
A recent study demonstrated that NGN2 overexpression alone can induce partial expression of non-glutamatergic neurotransmitter programs.19 Consistent with this, we detected the expression of cholinergic neuronal markers such as ISL1 and SLC5A7 (Figures 2B and S2A). However, the key acetylcholine synthesis enzyme choline acetyltransferase (ChAT) and vesicular acetylcholine transporter (SLC18A3) were absent in these cells (Figure S2B), demonstrating that the cholinergic program is likely incomplete.
As the sensory neuron sodium channel SCN9A, encoding Nav1.7, was expressed (Figure S2B), we investigated whether it is the dominant sodium channel. In the snRNA-seq data, we found that the CNS-dominant20 sodium channels SCN1A, SCN2A, SCN3A, and SCN8A, encoding Nav1.1, Nav1.2, Nav1.3, and Nav1.6, respectively, were also highly expressed (Figure S2B, bottom row). We then applied a selective Nav1.7 inhibitor (GNE-3565)21 to the iNs and measured the spontaneous neuronal activity with multiple-electrode arrays (MEAs). At the IC80 of Nav1.7 (2.5 nM), GNE-3565 did not inhibit spontaneous neuronal activities quantified by the percentage of active electrodes. In contrast, at 10 nM, which is the IC95 of Nav1.7 but also the IC45 of both Nav1.2 and Nav.1.6, GNE-3565 significantly reduced spontaneous neuronal activities by 29.1%, indicating that Nav1.2 and/or Nav.1.6 were major sodium channels driving the spontaneous neuronal activities. The TTX (tetrodotoxin) treatment at 1 μM eliminated these activities. These data demonstrate that, although the NGN2 iNs express Nav1.7 and typical CNS sodium channels, Nav1.7 is not the dominant sodium channel for spontaneous neuronal activities.
We evaluated batch-to-batch and line-to-line variations of this protocol (Figure 2C). At equivalent sequencing depths, the largest four clusters GPM6A+, GPM6A+ ISL+, GPM6A− HCN+, and GPM6A− ISL+ were identified in all four replicates (Figure 2C, blue and green). The GPM6A+ TAC+ cluster can be only found in the iP11N replicates, suggesting this cluster may be more sensitive to cell-line variability (Figure 2C, pink). We also noted that the immature cluster can only be found in one replicate (Figure 2C, red), indicating that batch-to-batch variabilities within the same iPSC background can be introduced by progenitor cells escaping anti-proliferation treatment. We further validated the reproducibility by performing correlation analyses among bulk RNA-seq data of day 28 NGN2 from different batches and DD iNs, and we found notable stronger correlations among NGN2 iN samples than with DD iNs (Figure S2D).
Lastly, to compare our protocol with the lentivirus-based NGN2 iNs, we generated Lenti-NGN2 iNs using the parental line of iP11N (iPS11). Neuron induction and maturation were performed with our NGN2 iN protocol (elaborated in STAR Methods). SnRNA-seq data showed a distinct PRPH+ cluster in the Lenti-NGN2 sample (Figure S2E, green), suggesting stronger PNS features in the Lenti-NGN2 iNs.
NGN2 iN culture recapitulates key transcriptional signatures of excitatory neuron maturation
A common obstacle in using iPSCs to model neurodegenerative disorders is that iPSC-derived neurons may not be mature enough to model adult neurons. The incomplete knowledge of transcriptomic maturation signature further exacerbates the problem. To tackle these issues, we set out to identify a list of maturation marker genes that can indicate neuronal maturation with in vivo relevance.
We first asked whether cell identity remains stable in our neurons with snRNA-seq (Figure S3A). Between day 42 and 56, snRNA-seq clusters were largely conserved (Figure S3A, top left, bottom) and similarly distributed in proportions (Figure S3A top right), suggesting that distinct neuronal types were determined by day 28.
We performed bulk RNA-seq (at days 14, 21, 28, 42, and 56, with day 0 being iPSCs) and proteomics (days 28 and 56) and leveraged an in vivo snRNA-seq dataset on the developing human cortex22 to identify genes with consistent temporal signatures in these datasets (Figure 3A).
Figure 3.

Transcriptional maturation signature of NGN2 iNs
(A) Schematics of the strategy to identify neuronal maturation markers in NGN2 iNs.
(B) Principal-component analysis (PCA) of bulk RNA-seq from maturing NGN2 iN. Time points are separated along the PC1 axis. Each dot represents an independently prepared culture sample.
(C) Clustered genes with RNA levels correlated with in vitro maturation days (absolute values of Spearman correlation score >0.9). Among highly expressed genes (minimum log(NRPKM) >2), 1,036 genes are positively correlated to in vitro days (top two blocks) and 557 negatively correlated (bottom two blocks).
(D) Cross-check of differential expression (day 56 vs. day 28) in RNA-seq and proteomics dataset. Genes that fall in quadrants 2 and 4 were eliminated as their RNA and protein potentially follow different maturation trends.
(E) Spearman correlation scores between NGN2 transcription profile and in vivo excitatory neurons (pseudo-bulk). Genes that passed the proteomics cross-check in (D) were used. In vivo ages range from gestation week 22 (Gw22) to postnatal year 40 (Py40). Dashed lines indicate the time of birth. Colored lines indicate fitted curves and shades indicate standard errors. Arrowheads indicate postnatal day 86 (Pd86) where curves peak at differentiation days 42 and 56.
(F) Directions of RNA-level fold changes in NGN2 iNs (day 56 vs. 14, x axis) and in vivo excitatory cortical neurons (Pd86 vs. Gw22, y axis). Genes that fall in quadrants 2 and 4 were eliminated.
(G) RNA levels of representative maturation marker genes selected from (F). NGN2 iN RNA expressions (left panel) follow similar developmental patterns as the in vivo excitatory neurons (right panel).
(H) Functional snippets and cell-type specificities of the representative genes shown in (H). Cell-type specificities were concluded from adult cortical tissue snRNA-seq data that does not contain neuron progenitor clusters (human MTG 10× SEA-AD dataset. MTG, middle temporal gyrus; SEA-AD: Seattle Alzheimer's Disease Brain Cell Atlas). The full list of neuronal markers can be found in Table S2.
(I) Top GO terms for up markers (F, quadrant 1) and down markers (F, quadrant 3). Purple texts are under the same parental GO term “transmembrane transporter activity.”
Principal-component analysis (PCA) of the bulk RNA-seq data indicated that day 14, 21, 28, 42, and 56 NGN2 iNs were separated on the PC1 axis, suggesting a continued change of the transcription profiles in NGN2 iN cultures (Figure 3B). We selected a list of maturation-correlated genes by filtering genes whose RNA levels were highly correlated with maturation days (Figure 3C) and whose RNA and protein levels in NGN2 iNs follow the same developmental trends (Figure 3D, selection process elaborated in STAR Methods—derivation of maturation marker genes).
We further investigated which in vivo developmental stages most resembled our NGN2 iNs with a correlation analysis between a snRNA-seq cortical development dataset22 (hereby referred to as the Lister dataset) and our iN RNA-seq data. We first did correlation analyses between our iNs and various excitatory cortical neuron types in the Lister dataset and found the correlation scores to be similar (Figure S3B), further indicating that NGN2 iNs should be considered a general model for glutamatergic neurons without a well-defined regional identity.13,23 We therefore pseudo-bulked all excitatory neurons from the Lister dataset to perform a correlation analysis against our NGN2 iNs using the 688 candidate genes (Figure 3E). Pre-day-28 NGN2 iNs most resembled prenatal in vivo cortical excitatory neurons, with the maximum scores at gestation week 22 (Gw22). The overall correlation values increased between day 14 and day 21 (from an average of 0.28 to 0.35), suggesting the establishment of neuronal identity. Days 21 and 28 saw increased postnatal neuron scores (postnatal average score increases from 0.34 to 0.42), indicating an installment of postnatal features. Interestingly, days 28–56 had a continued drop in prenatal scores (0.42 at day 28, 0.38 at day 42, and 0.36 at day 56), suggesting a loss of prenatal neuron features. For individual genes that are developmentally significant, we observed a leveling-off of GRIN2B expression and continued upregulation of GRIN2A post day 28 (Figure S3C, with N-methyl-d-aspartate [NMDA] receptor-containing post-synapses confirmed by IF in Figure S3D). This pattern is similar to the neonatal switch from GRIN2B to GRIN2A in the NMDA receptor observed in human cortical tissues,24 further validating that day-28 NGN2 iNs have certain pivotal features of neonatal human neurons.
With the understanding of relative maturity between our iNs and in vivo neurons, we further distilled the candidate genes by eliminating genes whose in vitro and in vivo developmental trends were inconsistent (Figure 3F, elaborated in STAR Methods—derivation of maturation marker genes). This yielded 117 maturation markers, including 82 “up genes” and 35 “down genes” (Figure 3G for selected genes; Table S2 for the full list).
The functions of individual maturation genes found in this study are diverse (Figure 3H). To better synopsize the molecular signatures of the NGN2 iN maturation, we performed Gene Ontology (GO) enrichment analysis (molecular function). GOs for the up genes (Figure 3G, left panel) were mostly under the common GO of transmembrane transporter activity (GO:0022857, purple text in Figure 3G, left) suggesting the formation of functional synapsis. The rest of the terms point to the calcium-cyclic AMP (cAMP) pathway, which is essential for neuronal activity and AP (action potential)-induced gene expression control in neurons.25 GO analysis on the down genes (Figure 3G, right panel) themed DNA and RNA binding. These terms may signify cell cycle exit and a switch of RNA processing profile in maturing neurons.26
Maturation score MS-117 measures relative levels of neuronal maturity
To better quantify the neuronal maturation level of a given in vitro neuron sample, we developed a score that indicates neuronal maturation with the 117 maturation marker genes (MS-117). To ameliorate the dominance of the highly dynamic and highly expressed genes in calculating this score, we used the developmental fold changes of each gene to represent their dynamic ranges and the minimum RNA level of each gene to denote their baseline expression levels. With these, we derived a corrective coefficient for each marker gene (Table S2; detail of the derivation is described in STAR Methods—derivation of maturation scores). MS-117 is calculated as follows:
To cross-check the validity of the MS-117 in other iN monocultures, we generated a maturation time-course RNA-seq dataset with dual SMAD inhibition-based DD (see STAR Methods—directed differentiation of iPSCs to neurons). Indeed, MS-117s of the DD iNs were positively correlated with neural progenitor cell (NPC) differentiation days (Figure 4A, left), while certain genes did not follow the NGN2 trends (Figure 4A, right, gray vertical lines). This further supports that a score that reflects the collective changes of a group of genes, rather than a single gene expression, is more reliable in evaluating neuronal maturation.
Figure 4.

Transcriptome-based maturation scores assess neuronal maturation in iN cultures and in vivo samples
(A) Left: NPC-derived neuron differentiation stages versus their maturation score MS-117s. N = 3 (individual culture) for each time point. The relationship between NPC differentiation day (plus one to avoid calculating log0) and MS-117 was fitted with a logarithmic regression model. Right: Z score of each MS-117 gene showing trends in each gene in the maturing NPC-derived neurons. Up genes follow a general upward trend (upper panel) and down genes (lower panel) downward trend. Exceptions are highlighted with gray vertical lines to the right of the heatmap.
(B) MS-117 for each identified cluster in a published NGN2 iN single-cell dataset.18 Adjusted p values generated by one-way ANOVA show significant differences between any two days (p < 0.0001). Each data point was calculated from one cell.
(C) Left panel: MS-117 calculated for the pseudo-bulk data generated from the same dataset as (B).18 No significant differences in pairwise comparisons (p > 0.05). Right panel: percentages of proliferating cells in later datasets trend higher (fibroblasts, dividing NP, NP). N (individual pseudo-bulked sample) = 2, 3, 3, and 6 for days 5, 14, 28, and 35, respectively. Error bars: standard error.
(D) Maturation scores calculated with neuron-specific maturation markers and corrected by loading control gene CNR to reduce noise brought by proliferating cells (MS-NS). Adjusted p values as labeled on the graph (p < 0.05). Pairwise comparisons: Tukey honestly significant difference (HSD) test.
(E) RNA levels by log2(nRPKM + 1) of classical housekeeping genes in NGN2 iNs. Related to Figure S4.
(F) RNA levels of maturation-stable neuron-specific loading controls in iNs. Top row: RNA levels (log(nRPKM + 1)) of maturation-stable, neuron-specific loading controls in progenitor cells and neurons generated by DD.1 Days 2–21: progenitor cells. Day 77: neurons on day 56 of differentiation. Bottom row: log2(nRPKM + 1) of maturation-stable loading controls and classical loading control genes in developing NGN2 iNs generated in this study. Color code shared with (E).
(G) Left: MS-NS calculated from the BrainSpan bulk RNA-seq dataset.27 Panels separate brain regions. Colors indicate donor age. Right: lookup table for brain region acronym versus full name.
Neuron-specific maturation score indicates neuronal maturation in mixed cell types
To assess the performance of the MS-117 for samples that contain progenitors, we calculated the MS-117 of each cell in a published NGN2 iN scRNA-seq time-course dataset13 (Figure 4B). The scores increased over time in committed neurons (intermediate and SN [sensory neuron] clusters) but not proliferative cells (all other clusters). We then pseudo-bulked the same dataset before calculating the MS-117 of each sample (Figure 4C). Interestingly, MS-117 did not detect significant differences between maturation days. We reasoned that, over time, proliferating cells may have taken up an increasing percentage of the sample, diluting the maturation effects of the committed neurons. We therefore checked the percentage of proliferative cells in each sample and found that their average percentage increased from 5.6% in day-5 samples to 32.9% in day-35 samples (Figure 4C, right). Therefore, we concluded that only neuron-enriched genes should be included for assessing the maturity of samples containing progenitors.
To approximate the number of neurons within a mixed population, we first sought neuron-specific normalization genes. These genes should be among the most maturation-stable in neurons but should also be much lower in progenitor cells. We ranked all highly expressed genes (with minimum log nRPKM >2, nRPKM: normalized reads per kilobase gene model per million total reads) based on their coefficient of variation (CV) in the time-course data from the least variable (0%) to the most (100%). We noted that most of the classical housekeeping genes were not maturation stable (e.g., ACTB is at 71.26%. Figure 4E; full list, see Figure S4), which cautions against adopting classical housekeeping genes as “loading controls” for developmental studies. For maturation-stable genes, we selected the top 100 genes with the smallest CV. We then checked the expression of these genes in a bulk RNA-seq time course dataset1 spanning iPSC to iN. Cannabinoid receptor 1 (CNR1) was the most enriched in neurons and one of the most maturation stable (Figure 4F). Therefore, we opted to use CNR1 as a neuronal-specific normalization gene (Table S2).
We applied the same rationale to the 117 maturation markers to identify markers that were transcribed in much higher levels in neurons than in progenitors (neurons/progenitors >8). This yielded 25 genes (Table S2). We then calculated the neuron-specific maturation score (MS-NS) of the pseudo-bulk data with a new formula:
MS-NS better distinguished maturation stages in the pseudo-bulk data (Figure 4D), demonstrating similar maturation patterns to the committed neuron clusters in Figure 4C. Nonetheless, MS-NS did not capture significant maturation scores between every two neighboring time points, likely due to the limited sample size and the short time gap between time points.
Finally, we challenged the MS-NS against an in vivo RNA-seq dataset of developing brains spanning gestation week 8 (Gw8) and postnatal year 40 (Py40) and sampling various brain regions (the BrainSpan27 dataset). We saw a clear upward trend of the MS-NS across developmental stages in all brain regions represented by more than five samples (Figure 4G). This indicates that MS-NS is suitable for evaluating neuronal maturity in tissue samples. Interestingly, while temporal trends appeared similar, the absolute numbers of MS-NS varied greatly among brain regions. This indicates that MS-NS should not be used to compare neurons with different regional identities.
NGN2 iNs are functional excitatory neurons
Most of the existing NGN2 iN protocols require astrocyte co-culture or conditioned media for generating functionally mature neuron activity.6,8,11,13 However, we observed spontaneous neuronal activities sensitive to sodium channel blockers (Figure S2C). IF on NGN2 iNs monocultures also showed dense pre- and post-synaptic puncta colocalizing on MAP2+ soma and dendrites (Figure 5A), suggesting the establishment of excitatory synapses in the NGN2 iNs without astrocyte support.
Figure 5.

Functional signature of NGN2 iN maturation
(A) Representative IF images showing NGN2 iNs generate overlapping pre- and post-synaptic puncta (green, pre-synaptic markers VGLUT1 and SYNAPSIN1/2; red, post-synaptic markers HOMER1 and PSD95; white, cell bodies and dendrites labeled with MAP2. Day 56 differentiation. N > 3. Scale bar, 50 μm).
(B) Representative patch-clamp recordings in NGN2 iNs (2–8 weeks). Top panels show resting potentials and APs generated in iNs in response to current injections. The bottom panels show spontaneous excitatory post-synaptic currents recorded in iNs. Neurons show more frequent action potential (AP) events, lower resting membrane potential, and stronger inward currents as they mature.
(C) Membrane and AP properties measured with current clamping in NGN2 iNs (2–8 weeks). Older neurons have lower input resistance, higher rheobase, smaller AP widths, and higher maximum firing rate (left to right). Adjusted p values as labeled in graphs (p < 0.05). Tukey HSD test. Two independent recordings were performed. Each dot (N) represents one cell. N = 15, 12, 13, 19, and 11 for 2-, 3-, 4-, 6-, and 8-week time points, respectively. Dotted, colored lines denote previously reported neuronal activity levels from human brain slide recordings.28,29
(D) Spontaneous excitatory post-synaptic currents (sEPSCs) in NGN2 iNs (2–9 weeks). Left: percentages of cell population with sEPSC observed to steadily increase from week 2 to 9. Right: sEPSC frequency significantly increases post week 6 (middle) and amplitude slightly increases at 4 weeks. Adjusted p values when p < 0.05 are labeled in graphs. Two independent recordings were performed, each dot (N) represents one cell. N = 16, 11, 15, 16, and 7 cells for 2-, 3-, 4-, 6-, and 9-week time points, respectively; sEPSC-positive iNs are 6, 6, 12, 14, and 7 cells for 2-, 3-, 4-, 6-, and 9-week time points, respectively.
(E) Multiple electrode array (MEA) measurements of neuronal activity in NGN2 iNs (days 14–36). Percentages of active electrodes and mean firing rate show positive linear correlations with in vitro days. R2 values as labeld in graphs (> 0.95). See also Figure S5. N (independent culture wells) = 3.
(F) Representative MEA recordings of synchronized neuronal activities in NGN2 iNs around day 35. Upper panel, raster plots; lower panel, quantifications of firing rate. Note that bursts (indicated with dots in the lower panel) were detected during the day 33 recording, disappeared on day 34, and were detected again on days 35 and 36. Horizontal lines indicate the burst detection threshold (1.5 Hz). N (independent culture wells) = 3.
To test neuronal excitability, we performed patch-clamp recordings. In week 6–8 iNs, compared to week 2–4, resting potential decreased and current injection generated denser action potential (AP) events (Figure 5B, upper). We also observed stronger spontaneous excitatory post-synaptic currents over time (Figure 5B, lower).
When measuring passive membrane properties and AP dynamics, we saw a continuous decrease of input resistance with the rheobase plateauing at 6 weeks (Figure 5C, left two panels), suggesting the cell membrane actively incorporated ion channels and neurotransmitter receptors during this period. In addition, AP width and maximum firing rate stabilized at weeks 3–4 (Figure 5C, right two panels). Together, these results suggest that the single-cell electrophysiological properties of NGN2 iNs reach a steady state at 4–6 weeks (Figure 5C), in line with the measurements from adult human cortical neurons in acute slice preparation (red and blue lines in Figure 5C).28,29 Nevertheless, the exact contributions from ion channels and neurotransmitter receptors remain to be explored.
We further tested the functional connectivity between NGN2 iNs by using patch-clamp recordings (Figure 5D). Spontaneous excitatory post-synaptic current (sEPSC) recordings showed that 80% of the NGN2 iNs received functional inputs at week 4 (Figure 5D, left). sEPSC frequency significantly increased after week 6 (Figure 5D, middle), while amplitude plateaued at week 4 (Figure 5D, right). Thus, in our protocol, functional synapses are established in the majority of maturing NGN2 iNs at week 4 and synaptic events build up till week 6.
Overall, the patch-clamp recordings (Figures 5B, 5C, and 5D) follow a general functional maturation trajectory of neurons in early development.30,31,32
To establish an easily accessible functional assay for maturation, we cultured NGN2 iNs on high-density MEA plates and recorded the neuronal activities at days 13–36. We found the percentage of active electrodes the most correlative with NGN2 iN maturation days in MEA assays, with a linear coefficient of determination (R-squared) >0.9 and a linear correlation slope of 0.0458 (Figures 5E and S5F shows other activity parameters calculated by the instrument software). Synchronized neuronal activities by burst detection were typically observed in week 5 (Figure 5F). However, the detection of bursts seemed to be strongly affected by the time gap between media change and recording (Figure 5F).
High-throughput image analysis captures synaptogenesis and neurite outgrowth in maturing NGN2 neurons
IF-based assays are often the preferred method in analyzing neuronal maturation and health. Therefore, we developed an IF pipeline to assess synaptogenesis. We labeled MAP2, VGLUT1, and HOMER1 for cell bodies and dendrites, excitatory pre-synapsis, and post-synapses, respectively. We used an automated high-content confocal imaging system (ImageXpress Nano) to capture the maximum projections of confocal images. We then fed these images through an automated analysis pipeline (Figure 6A, right), and quantified, per MAP2+ cell, the MAP2 area, pre-synaptic puncta, post-synaptic puncta, and overlapping synaptic puncta that overlaid the MAP2 signal. Here, we observed a culture time-correlated increase of VGLUT1 counts over time (Figure 6B, lower-left panel). This indicates that pre-synaptic counts in the MAP2+ area can be used to approximate neuronal maturation.
Figure 6.

Benchmarking maturation assays with astrocyte-CM
(A) Image analysis pipeline quantifying synaptogenesis-related neuronal maturation. Left: examples of images captured with a high-content confocal imager for image analysis. Right: examples of MAP2+ cell bodies recognized with Cellpose (highlighted in color). Scale bars, 50 μm.
(B) Image analysis results: MAP2 area (squared pixels, upper left), VGLUT1 count (lower left), HOMER1 count (upper right), and overlapping VGLUT1 with HOMER1 (synapse count, lower right). y axes represent log2 values of quantifications. Significant (p < 0.05) pair-wise comparisons are labeled in graphs. Tukey HSD test. N = 27 for each condition, with three independent culture samples and nine images per sample.
(C) MEA measurements of NGN2 neuron activities. Percentages of active electrodes were consistently higher in CM-cultured NGN2 iNs than in DM-cultured neurons. p < 0.001. Two-way ANOVA. N (independent culture wells) = 6 for CM and DM respectively. Data are represented as mean ± SEM.
(D) More robust synchronized activities were observed in CM-cultured neurons compared with DM. Black dots label detected bursts. Horizontal lines indicate the burst detection threshold (1.75 Hz). Burst frequency in CM is significantly higher than in DM (p = 0.0298). Paired t test. N (independent culture wells) = 6 for CM and DM respectively. Data are represented as mean ± SEM.
(E) MS-117 is higher in CM-cultured NGN2 iNs compared with DM counterparts (p = 0.004). Paired t test. N (independent culture wells) = 5 for CM and DM.
(F) Log fold change (logFC), false discovery rate (FDR), and average expression (AVExp) in top differentially expressed maturation markers.
(G) GO analysis of top differentially expressed genes in CM compared with DM (logFC > 1.5 or <−1.5).
Benchmarking neuron maturation assays with astrocyte-conditioned medium
We sought to compare our neuronal maturation readouts to see if they sufficiently captured the maturation-enhancing effects of astrocyte-conditioned media.33,34 We generated NGN2 iNs matured in either mouse conditioned medium (CM) (details in STAR Methods) or the defined medium (DM). Then, we performed the imaging-, MEA-, and RNA-seq-based maturation assays on these cells.
The imaging assay showed that VGLUT1/cell was not significantly elevated in the CM group until day 56 (Figure 6B, lower left). In contrast, with the MEA readout, CM-cultured NGN2 iNs continuously outperformed DM throughout culture time (Figure 6C). This suggests that the MEA assay is likely to be more sensitive in detecting enhanced neuronal maturation than the IF assay. CM also had a prominent positive effect on the development of synchronized activities when cells were prepared and recorded at the same time (Figure 6D).
We also performed bulk RNA sequencing on NGN2 iNs cultured in DM and CM at week 6. MS-117 was significantly higher in CM compared with the DM group (Figure 6E), although the magnitude of differences was subtler than what was captured in the MEA assay, indicating a lower sensitivity as well.
We noticed that only 16 out of the 117 maturation marker genes were significantly changed by more than 1.5-fold in the CM-cultured samples. To understand the molecular functions that may evade capture by the 117 markers, we performed GO enrichment analysis (molecular functions) on genes with an absolute fold change >1.5 and a false discovery rate (FDR) <0.05 (Figure 6G). The top terms for the CM-up genes were similar to the top GO terms for the maturation marker genes (Figure 3I, left). Interestingly, GO terms that were not enriched in the maturation score genes were demonstrated by individual gene functions among the 117 markers, such as actin-related functions, ribosome functions, and SNARE complex functions (Table S2, highlighted in bold in the “function snippet” column). This suggests that the current protocol may not recapitulate some aspects of neuronal maturation and may require astrocyte co-culture or other cell-cell interactions.
Using MEA maturation assay to screen basal media for neuronal maturation
Although astrocyte-conditioned medium clearly promotes neuronal maturation, it is difficult to adopt for large-scale studies. Therefore, we sought to leverage the MEA maturation assay to screen different commercially available basal media and compare their short- and long-term performance in supporting neuronal maturation. We tested Neurobasal, Neurobasal-A, Neurobasal-Plus, BrainPhys, and iCell Neural Base Medium 1, which are widely adopted in the field. For BrainPhys, considering its much lower glucose concentration,35 we also tested BrainPhys supplemented with 20 mM glucose. We used the same supplements as DM in all tested basal media except for the iCell medium, where the manufacturer-recommended iCell supplements were used (iCell Neural Supplement B and Nervous System Supplement). Cells were cultured with DM until day 14 before being switched into the tested media, and the percentages of active electrodes were tracked till day 41 (Figure S6A). Neurobasal, Neurobasal-A, Neurobasal-Plus, and iCell showed similar steady increases of activities from day 14 to 41, while Neurobasal-A (Figure S6A, red) significantly outperformed all the other media conditions from day 28. Interestingly, although BrainPhys appeared beneficial for neuronal activities till day 25, neuronal activities saw a stagnation followed by a decline from day 25 to 35 (Figure S6A, light green). The glucose supplement rescued this decline, but not the stagnation (Figure S6A, dark green). These data suggest that, in our culture conditions, BrainPhys elevates neuronal activity in the short term but is less supportive of long-term development and maintenance of neuronal maturation.
The only difference between Neurobasal-A and Neurobasal is its higher NaCl concentration.35 To further understand whether the elevated neuronal activity is a transient effect brought by stronger sodium currents, we used Neurobasal-A (with DM supplements) as the recording medium in iNs maintained in each type of aforementioned basal medium. Cells were acclimated for 1 h after medium change at 37°C before recording (Figure S6B). For Neurobasal and iCell, the percentages of active electrodes significantly increased. However, Neurobasal-A-maintained iNs still outperformed all other media, which indicates that Neurobasal-A has a long-term effect in elevating neuronal activities. Interestingly, activities significantly dropped after media change in the case of BrainPhys + glucose, possibly because BrainPhys contains an even higher sodium concentration than Neurobasal-A.14
NGN2 iNs are suitable for modeling various neurological disorders
To explore the utility of NGN2 iNs as in vitro human models for neurodevelopmental and neurodegenerative disorders, we compiled a list of genome-wide association study (GWAS) genes of Alzheimer’s disease (AD), Parkinson’s disease (PD), and autism spectrum disorder (ASD) from GWAS Catalog and SFARI.36,37 We then checked the expression of these genes in our bulk RNA-seq data (days 14–56) and found that 2,374 of the 3,163 GWAS genes (75.1%) expressed (nRPKM > 2) in the NGN2 iNs in at least one time point, and 1,403 genes (44.4%) were highly expressed with log nRPKM > 2 (Table S1). We further checked common genes associated with AD, PD, and ASD in the day-28 snRNA-seq data (APOE, MAPT, APP, SNCA, PRKN, CHD8, MECP2, FMR1, SETD5) and found that disease-gene-expressing cells were distributed across all clusters (Figure 7A). These observations support the notion that NGN2 iNs can be suitable for studying genes related to various neurodevelopmental and neurodegenerative disorders.
Figure 7.

NGN2 neurons can be suitable for disease modeling
(A) UMAPs of day 28 snRNA-seq data of NGN2 iNs showing expression and distribution of representative AD (APOE, MAPT, APP), PD (SNCA, PRKN), and ASD (CHD8, SETD5, MECP2, FMR1) genes. Expressed genes appear to be evenly distributed throughout clusters.
(B) Left: gene dendrogram and module colors for gene modules found with WGCNA analysis. Right: relationships between gene modules and NGN2 iN maturation days. Colors indicate correlation value. Gray boxes: modules significantly enriched with ASD GWAS genes. FDR = 1.14e−18 (black); 1.59e−20 (turquoise); 9.36e−4 (light cyan).
(C) Top: overlap between the maturation genes selected for MS-117 and the turquoise module. Bottom: turquoise module GO enrichment (biological processes).
(D) Western blot showing TAU isoforms in NGN2 iNs at differentiation day 150. Cell lysates were treated with λ phosphatase. First lane: TAU ladder. Top panel: all tau isoforms can be detected. 0N3R is the dominant band. Middle panel: 2N3R and 2N4R Tau detected with 2N Tau antibody. Bottom panel: β-actin as loading control. N (individual cultures) = 6.
To further elucidate whether disease-relevant genes were captured by gene networks in our temporal neuronal maturation dataset, we performed a weighted correlation gene network analysis (WGCNA). Among the modules that significantly correlated with maturation days, three (black, turquoise, light cyan) were significantly enriched with ASD GWAS genes (FDR 1.14e−18, 1.59e−20, 9.36e−4, respectively; Figure 7B), indicating that these iNs can model neuronal development. Interestingly, 110 out of 117 MS-117 genes were enriched in the turquoise module (Figure 7C, upper). GO analysis of the module indicates neurodevelopmental terms (Figure 7C, lower). These results further demonstrate that MS-117 is a relevant indicator of neuronal maturation.
Without pathological manipulations, NGN2 iNs are not in themselves a neurodegenerative model. Consistently, in our WGCNA analysis, we did not find gene modules enriched with AD and PD GWAS genes.
Modeling neurodegenerative disorders may require adult-level neuronal maturity. For example, the 4R splicing variant of TAU is involved in various forms of tauopathy. However, most of the current iN models, resembling embryonic neurons, exclusively express the 0N3R variant of TAU.38 Current strategies using iPSCs to study 4R-isoform-associated tauopathy typically introduce mutations to manipulate TAU splicing.17,18,19,20,21,22,23,24,25,26,27,28,29,30,31,32,33,34,35,36,37,38,39 In our NGN2 iNs, all adult isoforms of TAU could be observed by day 150, although the 4R/3R ratio does not reach an adult human level of 1:1 (Figure 7D). This indicates that, with extended maturation time and no genomic manipulation, our NGN2 iNs can be used to study 4R TAU-associated tauopathy.
A streamlined gene-editing workflow to engineer inducible NGN2 iPSC lines
In the case of disease modeling, PSC lines are often derived from patients or with disease-associated mutations already engineered into existing lines. To facilitate researchers to apply this protocol on their existing iPSCs, we developed a strategy to efficiently integrate the dox-inducible NGN2 into the AAVS1 safe-harbor site. We chose the Kof2.1-J iPSC line and the CRISPR ribonucleoprotein (RNP) method for engineering.40 In donor design (Figure S7A; Data S3), we included an mScarlet and a Blasticidin-resistance (BlastR) gene near the left and right homologous arms, respectively, which helps to enrich for homology-directed repair (HDR) through blasticidin selection and visual inspection (Figure S7D, bottom row). We also integrated a guide RNA (gRNA) targeting sequence with mismatches so that the same gRNA that targets AAVS1 also linearizes the donor plasmid, increasing the integration rate.41 Considering the BlastR or mScarlet may interfere with downstream applications, we flanked them with FRT (flippase recognition target) or LoxP pairs.
We further streamlined an engineering workflow that enriches HDR events and reduces the number of colonies to be screened (Figure S7B; method described in detail in STAR Methods). Based on previous reports and our in-house optimization, we adopted high cell density to promote survival rate after nucleofection, 32°C cold shock and an HDR enhancer cocktail to promote HDR,42 and a transient blasticidin selection (days 2–4) to enrich for transfected cells.43 With this method, we confirmed 10 targeted edits in only 16 picked colonies.
To reduce the time and downstream labor spent on expanding, stocking, and screening clones, we combined the colony expansion step with a genotyping + “phenotyping” step, where the picked clumps from a single colony were split into three parts, each consisting of three to four chunks. One-third of the colony was plated for colony expansion. The second one-third was plated on in NGN2 induction day 0 medium for confirming neural induction (phenotyping). The remaining cells were lysed for genotyping PCR. This ensures that, by the time colonies are ready to be passaged again, the desired clones have already been identified.
Overall, we demonstrate our editing workflow to be rapid and efficient in generating clonal NGN2 cell lines from existing iPSC lines. Together with our NGN2 iN protocol, this engineering method can be a useful tool for developing disease models.
Discussion
NGN2 iNs recapitulate multiple aspects of neuronal maturation
A previous study8 reported that, with astrocyte co-culture, day-49 NGN2 iNs’ transcription profile has the highest correlation with prenatal human cells. In comparison, our NGN2 iNs at day 42 correlate best with postnatal day-86 neurons in vivo. Thus, our protocol likely generated more mature neurons than previously reported NGN2 iNs within a similar time frame.
To date, there has not been a good consensus on high-throughput assays that can quickly assess neuronal maturity, which is likely to be more complex than just longer neurites and denser synapses.44 Our maturation scores provide a more nuanced maturation profile.
Within the 117 maturation markers, we found that the functions of the maturation up genes contain many GO terms, indicating the excitability and synaptic functions of neurons. Perhaps more interestingly, many down genes signify the changes in DNA/RNA-protein interactions, possibly as a consequence of cell-cycle exit and changes in RNA processing. These are aspects of neuronal maturation not directly related to neuronal excitability and synaptogenesis. One of the down markers, HNRNPA1, has been reported to promote the prenatal45 3R variant of TAU. Perhaps maturation can be further accelerated by pushing the downregulation of such markers.
We further distilled an MS-NS that can be used in bulk RNA-seq data containing multiple cell types, including tissue data. This expands the use-case scenarios beyond neuron monocultures.
In addition, we developed high-content imaging and MEA-based workflows in assessing NGN2 iN maturation, suitable for laboratories with different instruments and expertise.
Applicability of NGN2 iNs toward disease modeling
Our data on neuronal maturation correlation analyses, expression patterns of NMDA receptors, and TAU isoforms, together with the GWAS gene-expression analyses and the WGCNA analysis, demonstrate that our cells mature into postnatal-like neurons and can be suitable for disease modeling.
We speculated that an obstacle in adopting our NGN2 iN method in many laboratories would be that the inducible NGN2 machinery is not already engineered into their iPSC lines. Therefore, we streamlined a protocol to generate NGN2 lines with targeted engineering. Our method focuses on enriching HDR events and minimizing engineering time and labor. In addition, the workflow can be easily converted into other targeted knockin projects. This can break a daunting technical barrier in iPSC disease modeling.
We believe these methods and insights are valuable for the field of iPSC-derived neurological disease models.
Limitations of the study
Generating high-quality iN cultures
Quality control (QC) of iPSCs is essential in generating physiologically relevant and high-quality iN cultures. We standardized a QC procedure and used a high-resolution karyotyping method (Karyostat+) to validate chromosomal integrity, as described in STAR Methods. When chromosomal abnormalities were detected, we screened subclones from the earliest vials available to identify karyotypically normal clones.
Generating long-term iN cultures that do not clump requires removing reminiscent progenitor cells. Such aggregated cells destabilized the physical structure of the culture as they were prone to detachment during media changes and assay processes. We found that clumps consisted of progenitor cells. Therefore, the treatment of anti-mitotic reagents in this protocol is essential.
Selecting the right iN protocol for disease modeling
The NGN2-overexpression method of generating excitatory neurons had some inherent flaws in their transcriptional profile.23 For example, our NGN iNs do not express FOXG1, a telencephalon marker. Previously published protocols report contradicting evidence of FOXG1 expression in NGN2 iNs.6,8,19 A recent study reported that, for NGN2 overexpression to exclusively drive forebrain neuron identity, coexpression of EMX1 or FOXG1 is required to redirect NGN2 from partially driving other neurotransmitter programs, implying that NGN2 does not automatically drive FOXG1 and EMX1 expression.19 This could help explain the expression of some cholinergic neuron genes in our protocol. In addition, we and others found that NGN2 iNs express sensory neuronal markers. Therefore, we recommend considering NGN2 iN neuronal models as general excitatory neurons and choosing a suitable DD method when the neuronal subtype is essential.
Single-layer monocultures are straightforward to assay and analyze. In the context of disease modeling, it helps to tease out the unique pathological contribution of a single cell type. Nevertheless, it cannot fully recapitulate the in vivo scenarios brought by complex cell-to-cell interactions and cell-to-ECM interactions in a three-dimensional solid tissue with low stiffness. Complex modeling protocols can be built upon monocultures by mixing a defined ratio of cells, adding secreted factors that affect neurons such as cytokines and neurotrophic factors, and incorporating attaching substrates such as ECM molecule-incorporated hydrogel.46,47,48
Our characterizing data can be used to judge whether this cell model is suitable for specific neuronal disorders. However, further characterization may be necessary for targeting specific disease mechanisms. For example, NMDA receptor (NMDAr) abnormalities are a common theme of many neurodevelopmental disorders.49 We demonstrate that NMDAr-subunit-containing synapses are expressed in NGN2 iNs, and the expression time courses of GRIN2A and GRIN2B, are similar to what was found in vivo.24 However, we have yet to demonstrate that NMDAr-containing synapses are functional by electrophysiology techniques and how the NMDAr-driven neuronal activities change over time. Therefore, our model might not be suitable to model NMDAr-associated diseases.
Choosing a suitable assay to evaluate the maturation of iN cultures
We developed two transcriptomics-based maturation scores (MS-117 and MS-NS), an image-based neuronal morphology assay, and an MEA-based functional assay to determine the maturation levels of NGN2 iNs. While adopting these assays, it is important to understand the advantages and caveats of each method.
MS-117 is derived from all of the maturation genes that were found to be present and strongly correlated with maturation time both in vitro and in vivo. This score reflects many aspects of neuronal maturation. However, many neuronal cultures contain high proportions of progenitor cells, which may dilute the RNA level changes in maturing neurons when tested in bulk. In this case, MS-NS, which includes neuron-specific maturation markers and a normalization gene, better captures the maturation of neurons in mixed cultures or tissue. While using MS-NS, it is important to keep in mind that many pathways, including all of the down markers, are excluded.
The 117 maturation genes were selected from what is expressed in our NGN2 model. This approach aimed to capture in vitro neuronal maturation with a good sensitivity. However, this also means genes that were maturation related in vivo but were not recapitulated in our in vitro model were not addressed here. To further optimize in vitro neuronal models, it will be interesting to explore the in vivo maturation markers that were not represented in our iNs.
We developed an automated high-content imaging and data analysis pipeline to quantify synaptogenesis and neurite outgrowth. Our method is open source and instrument agnostic and can be adopted by any laboratory with access to high-content imagers. However, this method seemed less sensitive in capturing neuronal maturation compared with the MEA method.
The MEA-based method directly reflects neuronal functions. It also allows for repeated measurement of live cultures. However, considering the limited throughput (six-well plates only for the MaxTwo system) and accessibility of MEA instruments, we recommend using the MEA assay as a small-scale or conformational assay for neuronal maturity.
Resource availability
Lead contact
Information and requests for resources should be directed to the lead contact, Claire Jeong (jeong.claire@gene.com).
Materials availability
Materials generated in this study may be available from the lead contact with a completed materials transfer agreement.
Data and code availability
-
•
Raw proteomics data files were deposited into the MassIVE repository with the identifier MassIVE: MSV000093150. The snRNA-seq data and bulk RNA-seq on NGN2 iNs generated in this study have been deposited in the Gene Expression Omnibus (GEO) repository under accession number GEO: GSE244371, DD iN time-course data under GEO: GSE266359, and the rest of data related to Figure S2D under GEO: GSE273553. These datasets will be publicly available as of the date of publication.
-
•
This study generated original code as an image analysis pipeline for measuring neuronal maturity (Data S1).
-
•
Any additional information needed to reanalyze the data reported in this study will be provided by the lead contact upon request.
Acknowledgments
The authors would like to acknowledge Min Jung and Brad Friedman for bioinformatics consultation; Baris Bingol, Joanna Lipka, Sang Seo, Alejandro Lopez Tobon, and Ada Ndoja for critical inputs of the manuscript; Panos Theofilas for generating lentivirus NGN2 iPSCs; Zora Modrusan and the NGS core facility for performing RNA sequencing; and Max Adrian for facilitating imaging setups.
Author contributions
Conceptualization, C.G.J. and X.S.; methodology, C.G.J., X.S., and A.Z.; software, A.Z., M.G.R., X.S., and M.C.; validation, X.S.; formal analysis, A.Z., M.G.R., X.S., M.C.-T., and M.C.; investigation, X.S., A.Z., C.S.-P., Y.Z., M.B.C., L.P., J.M.A.L., A.L.C., Q.Z., and J.M.P.; resources, C.G.J., C.C.H., C.M.R., and M.B.C.; data curation, M.G.R., A.Z., X.S., M.C., L.P., and C.M.R.; writing – original draft, X.S., A.Z., M.G.R., C.S.-P., L.P., M.C., and J.M.A.L.; writing – review & editing, X.S., C.G.J., A.Z., M.C.-T., M.G.R., C.S.-P., L.P., J.M.A.L., and C.C.H.; visualization, X.S., A.Z., and M.C.-T.; supervision, C.G.J., C.C.H., and C.M.R.; project administration, X.S. and C.G.J.; funding acquisition, C.C.H., C.G.J., and C.M.R.
Declaration of interests
All authors are employees of Genentech, Inc., a member of the Roche group.
STAR★Methods
Key resources table
| REAGENT or RESOURCE | SOURCE | IDENTIFIER |
|---|---|---|
| Antibodies | ||
| CUX1 | ProteinTech | RRID: AB_2086995 |
| CUX2 | Novus | RRID: AB_10967250 |
| MAP2 | Abcam | RRID: AB_2138153 |
| GABA | Abcam | RRID: AB_1925012 |
| CTIP2 | Abcam | RRID: AB_2064130 |
| TBR1 | Abcam | RRID: AB_2200219 |
| FOXG1 | Millipore | Cat#: MABD79 |
| FOXG1 | Abcam | RRID: AB_732415 |
| FOXG1 | Takara | Cat#: M227 |
| NESTIN | Abcam | RRID: AB_2753197 |
| VGLUT1 | Synaptic System | RRID: AB_887880 |
| HOMER1 | Synaptic System | Cat#: 160003 |
| SYNAPSIN 1/2 | Synaptic System | RRID: AB_1106784 |
| PSD95 | DSHB | RRID: AB_2877189 |
| Oct3/4 | STEMCELL Technologies | Cat#: 60093.1 |
| Oct3/4 | GeneTex | RRID: AB_2037563 |
| Nanog | R&D Systems | RRID: AB_355097 |
| Sox2 | Abcam | RRID: AB_2341193 |
| Sox2 | R&D Systems | RRID: AB_358009 |
| Total Tau | Dako | RRID: AB_10013724 |
| 2Ntau | Abcam | RRID: AB_3068611 |
| beta-actin | Millipore | RRID: AB_476692 |
| Donkey-anti-Mouse-Alexa488 | Jackson Immuno | RRID: AB_2341099 |
| Donkey-anti-Rabbit-Alexa488 | Jackson Immuno | RRID: AB_2313584 |
| Donkey-anti-Mouse-Alexa594 | Jackson Immuno | RRID: AB_2340855 |
| Donkey-anti-Rabbit-Alexa594 | Jackson Immuno | RRID: AB_2340621 |
| Donkey-anti-Rat-Alexa594 | Jackson Immuno | RRID: AB_2340689 |
| Donkey-anti-Chicken-Alexa488 | Jackson Immuno | RRID: AB_2340375 |
| Donkey-anti-Chicken-Alexa647 | Jackson Immuno | RRID: AB_2340379 |
| Chemicals, peptides, and recombinant proteins | ||
| mTeSR Plus | STEMCELL Technologies | 100–0276 |
| DMEM/F12 (no glutamine) | Life Technologies | 21331020 |
| Neurobasal | Life Technologies | 21103049 |
| STEMdiff™ SMADi Neural Induction Kit | STEMCELL Technologies | 8581 |
| Neurobasal-A | Life Technologies | 10888022 |
| Neurobasal Plus | Life Technologies | A3582901 |
| iCell Neural Base Medium 1 | FujiFilm Cellular Dynamics | M1010 |
| BrainPhys | STEMCELL Technologies | 5790 |
| CloneR2 | STEMCELL Technologies | 100–0691 |
| GlutaMAX | Gibco | 35050061 |
| NEAA | Gibco | 11140076 |
| B27 without VA | Gibco | 12587010 |
| N2 Max | R&D Systems | AR009 |
| B27 with VA | Gibco | 17504044 |
| Y-27632 | STEMCELL Technologies | 72302 |
| RevitaCell | Gibco | A2644501 |
| Doxycycline | R&D Systems | 4090/50 |
| DAPT | STEMCELL Technologies | 72082 |
| Arabinocytidine | Sigma | C1768 |
| Mitomycin C | Tocris | 32585 |
| 5-Fluorouracil | Sigma | F6627-1G |
| SB431542 | STEMCELL Technologies | 72232 |
| Noggin | Myltenyi | 130-108-982 |
| XAV939 | STEMCELL Technologies | 72672 |
| BDNF | Myltenyi | 130-103-435 |
| GDNF | Myltenyi | 130-129-546 |
| dcAMP | Sigma | D0627 |
| Ascorbic acid | Sigma | A4403 |
| iCell Neural Supplement B | FujiFilm Cellular Dynamics | M1029 |
| iCell Nervous System Supplement | FujiFilm Cellular Dynamics | M1031 |
| FGF-2 | Myltenyi | 130-093-839 |
| EGF | R&D Systems | 236-EG-01M |
| DPBS (wihout Ca2+ Mg2+) | Gibco | 14190144 |
| iMatrix-511 | Takara | 892 012 |
| Geltrex LDEV-Free, hESC-Qualified, Reduced Growth Factor | Gibco | A1413301 |
| Matrigel hESC-Qualified Matrix, LDEV-free | Corning | 354277 |
| Poly-d-lysine (PDL) | Sigma | P6407-10X5MG |
| ReLeSR | STEMCELL Technologies | 5872 |
| Accutase | STEMCELL Technologies | 7920 |
| Papain | Worthington | LK003178 |
| TripLE Express | Gibco | 12604013 |
| Cryostor CS10 | STEMCELL Technologies | 100–1061 |
| Alt-R HDR Enhancer V2 | IDT | 10007921 |
| Alt-R S.p. HiFi Cas9 Nuclease V3 | IDT | 1081061 |
| CRISPRevolution sgRNA EZ Kit (10 nmol) - AAVS1-S1T1 | Synthego | Custom made |
| P3 Primary Cell 4D-Nucleofector X Kit S | Lonza | V4XP-3032 |
| Formaldehyde, 16% | Pierce | 28908 |
| BSA | Rockland | BSA-30 |
| DAPI | Invitrogen | D1306 |
| Critical commercial assays | ||
| RNeasy Plus Mini | Qiagen | 74134 |
| STEMCELL Genetic Analysis Kit | STEMCELL Technologies | 7550 |
| MycoAlert | Lonza | LT07-318 |
| QuickExtract DNA Extraction Solution 1.0 | LGC | QE09050 |
| Q5 High-Fidelity 2X Master Mix | NEB | M0492L |
| Deposited data | ||
| Proteomics data | This paper | MassIVE: MSV000093150 |
| RNAseq data | This paper | GEO: GSE244371; GEO: GSE266359; GEO: GSE273553 |
| In vivo developmental scRNA seq of human cortises (Lister dataset) | Herring et al. 202222 | GEO: GSE168408 |
| NGN2 iN scRNAseq dataset | Schörnig et al. 202113 | ArrayExpress: E-MTAB-9233 |
| BrainSpan dataset | Li et al. 201827 | dbGAP: phs000755 |
| Bulk RNA seq data of directed differentiated neurons | Burke et al. 20201 | BioProject: PRJNA596331 |
| Experimental models: Cell lines | ||
| iP11N | ALSTEM | iP11N |
| iNgn2-dCas9-KRAB ("G12") | ALSTEM | Custom-made |
| iPS11 | ALSTEM | iPS11 |
| Kof2.1J | Jackson Laboratory | RRID: CVCL_B5P3 |
| Oligonucleotides | ||
| CRISPRevolution sgRNA EZ Kit (10 nmol) - AAVS1-S1T1 | Synthego | CACAGGUAAAACUGACGCA - Modified |
| Genotyping Primers-F | IDT | cctaagaacttgggaacagcca |
| Genotyping Primers-R | IDT | ccgcaacttgtttattgcagctta |
| Recombinant DNA | ||
| pMin_NGN2_EF1a_Blast_KA2.14 | Custom synthesized at GenScript | Sequence in Data S2 |
| AAVS1_UBC-blast_NGN2-TRE3G_EF1a_IRES-mScarlet 2 | Custom synthesized at GenScript | Sequence in Data S3 |
| Software and algorithms | ||
| R version 4.2.1/Bioc 3.16 PRD | CRAN | https://cran.r-project.org/ |
| Prism-GraphPad | GraphPad Software | https://www.graphpad.com/ |
| CellProfiler | Broad institute | https://cellprofiler.org/ |
| Cellpose | Cellpose | https://www.cellpose.org/ |
Experimental model and study participant details
Cells (human or mice) were cultured at 37°C, 5% CO2, ambient O2, and >90% humidity. The cold-shock step in cell engineering was performed at 32°C, 5% CO2, ambient O2, and >90% humidity. iPSC lines iP11N and iPS11 were purchased from ALSTEM. The iNgn2-dCas9-KRAB-cloneG12, or "G12" line was custom-made by ALSTEM. ALSTEM iPSC lines were derived from the foreskin fibroblasts of a male donor by the vendor. Further information on the donor is unavailable. The KOF2.1J iPSC line was acquired from Jackson Laboratory. The original donor of the KOF2.1J parental line is a 55–59 year old, Caucasian male.
Cells from the vendor were thawed with mTeSR Plus media onto Matrigel-coated tissue culture vessels with CloneR2 supplemented for 1 day (passage 0, P0). Media were changed every other day. At 75% confluency, iPSCs were passaged 1:6 as clumps by incubating with ReLeSR for 5 min (min) at 37°C. iPSCs from passage 1 were plated onto iMatrix 511-coated tissue culture vessels and cryopreserved with CryoStor CS10 at 75% confluency as clumps. Four vials per well of 6-well plates were generated, and cryovials were stored in liquid nitrogen tanks.
Method details
iPSC QC
iPSC lines were QC’d with mycoplasma test (MycoAlert, every 2 weeks while maintaining iPSC cultures), and STEMCELL genetic analysis kit (every 5 passages) for fast checks of genomic integrity. Before banking, cells were collected for the Karyostat+ test (for high-resolution genomic integrity), Embryoid body free differentiation with ScoreCard test (for pluripotency and lineage tendencies), morphology check, and IF pluripotency markers check (Sox2, Nanog, Oct3/4). ScoreCard results for iPSCs should show no differentiation, and for differentiated EBs, ScoreCard results should show average or elevated scores for all three lineages. All iPSCs should be positive for iPSC IF markers.
Thawed iPSCs were cultured and passaged for 2 weeks, with 4–5 passages, before performing NGN2 neuron induction. iPSC cultures did not have any visible differentiating cells before induction.
NGN2 neuron induction, cryopreservation, and maintenance
Tissue culture and immunofluorescence reagent vendors and catalog numbers are documented in the “key resources table”.
Media compositions are listed below.
-
•
Induction day 0 medium: mTeSR Plus supplemented with RevitaCell (1:100, can be replaced with Y-27632, 10 μM) and doxycycline (3 μg/mL).
-
•
Induction medium (days 2–5, “IndM1-5”): DMEM/F12 (no glutamine) supplemented with Glutamax (1x), NEAA (1x), B27 w/o Vitamin A (1x), N2 Max (1x), DAPT (10 μM), SB431543 (10 μM), Noggin (100 ng/mL), XAV939 (2 μM), and doxycycline (3 μg/mL).
-
•
Defined maturation medium (DM): Neurobasal (no glutamine) supplemented with Glutamax (1x), NEAA (1x), B27 with Vitamin A (1x), hBDNF (20 ng/mL), hGDNF (20 ng/mL), ascorbic acid (200 μM), and N6,2′-O-Dibutyryladenosine 3′,5′-cyclic monophosphate sodium salt (dcAMP, 500 μM). Doxycycline (2 μg/mL) is included till day 14.
-
•
Replating medium: DM with DAPT (10 μM), doxycycline (2 μg/mL), and AraC (5 μM). We do not recommend including any ROCK inhibitor (such as Y-27632) in the replating media as it preserves progenitor survival much better than neuronal survival. AraC can be replaced with mitomycin C (0.25 μM) or 5-Fluorouracil (60 μM). As DAPT can affect neuronal processes such as Aβ cleavage and axon and dendrite extension,50,51 it is optional in the replating medium if affecting downstream applications.
-
•
Conditioned medium (CM): For generating astrocyte-conditioned media, primary mouse astrocyte cultures were derived from commercial postnatal mouse cortical tissues (postnatal days 0–20). Sex information was not provided by the vendor. Pooled postnatal mouse cortex (acquired from BrainBits, C57PASTCX4m) were dissociated with papain and plated on tissue culture vessels with DMEM/F12 + 10% fetal bovine serum (Sigma) + 0.2 ng/ml EGF, following instructions provided by BrainBits. Cells were expanded by passaging (1:4) twice with TriplE Express at full confluence to yield astrocyte cultures. To generate conditioned media, confluent mouse astrocyte cultures were washed twice with DPBS to remove serum and growth factors, and media (DM without BDNF, GDNF, dcAMP, and ascorbic acid) were added to the culture at a volume/cell culture surface ratio of 0.3 mL/cm2. Media were conditioned in 37°C, 5% CO2 incubators for 48 h. Collected media were centrifuged at 500g for 10min to remove debris, supplemented with BDNF, GDNF, dcAMP, and ascorbic acid, sterile-filtered, aliquoted, and stored at −80°C till use.
iPSC cultures at ∼75% confluency were visually inspected to ensure proper morphology and no precocious differentiation. Typically 300,000 cells/cm2 can be expected from this density. Cells were washed with Ca2+, Mg2+ -free dPBS, and then incubated with Accutase 37oC for 10 min. Accutase was used at a volume/cell culture surface ratio of 50 μL/cm2 and stopped with mTeSR Plus. iPSCs should easily detach without much trituration after incubation. Detached cells were mechanically dissociated into single cells by pipetting up and down 10 times with regular-bore 1 mL pipette tips and strained with 40 μm strainers. Cells were pelleted at 300 g for 5 min, resuspended in induction day 0 media (refer to media compositions above for details), counted, and plated at a density of 400,000 cells/cm2 on iMatrix-511-coated (1:200 in dPBS, >1h at 37°C) tissue culture vessels.
Fresh induction media (IndM1-5) were changed daily on days 1–4. On day 5, neurons were detached, dissociated, strained, and counted with the same method as iPSCs (described above). Neurons can be cryopreserved at 5–50 million/(mL∗Vial) with CryoStor CS10, or replated in PDL- (50 μg/mL) and iMatrix-coated tissue culture vessels (1:200 in dPBS) at 200,000 cells/cm2 in DM or CM to mature (refer to media compositions above for details). Partial media changes were performed every 3 or 4 days.
Generating NGN2 iNs with lentivirus
Dox-NGN2-Blast lentivirus was produced from pMin_NGN2_EF1a_Blast_KA2.14 (sequence provided in Data S2). iPS11 (380,000) was plated in a 12-well plate with Y-35631 and cultured overnight. The next day (day 1), lentivirus was added at an MOI of 12 in 600 μL media. On day 2, the medium was removed and cells were passaged to a 10 cm dish. On day 3, 20 μg/mL Blasticidin was added to select transduced cells for 5 days. Once cells were 70% confluent, they were differentiated using the NGN2 neural induction protocol described above.
Directed differentiation
Neural progenitor cells (NPCs) were generated from iPSCs using STEMdiff SMADi Neural Induction Kit following the manufacturer’s instructions. Briefly, iPSCs were cultured with mTeSR Plus media in iMatrix511-coated tissue culture vessels until 70–80% confluency. iPSCs were then dissociated with Accutase at 37°C for 10 min to generate single-cell suspensions. To initiate the neural induction, 3 million single cells were resuspended with 1 mL of STEMdiff Neural Induction Medium with dual SMAD inhibitors and ROCK inhibitor (10 μM of Y-27632) and seeded into one well of an AggreWell 800 24-well plate pre-treated with 500 μL anti-Adherence Rinsing Solution. Three-quarters of media changes with STEMdiff Neural Induction Medium supplemented with dual SMAD inhibitors (NIM-si) were performed daily for four days. On day 5, Embryoid bodies (EBs) from one well were replated in 2 mL of NIM-si and plated into a Matrigel-coated 35 mm dish using a serological pipette. Daily full media changes with NIM-si were performed for 6 days. On Day 12, neural rosettes were picked manually under a microscope and plated into one well of a Geltrex-coated 6-well plate. Daily full media changes with NIM-si were then performed for another 2–5 days until the cultures (Passage 0) were confluent and ready to be replated.
NPC medium (0.5X DMEM/F12, 0.5X Neurobasal, 1X B7 without vitamin A, 1X β-Mercaptoethanol, 1X Glutamax, 1X N2, 20 ng/mL FGF, 20 ng/mL EGF, 20 ng/mL BDNF) was used to maintain NPCs. Confluent NPCs were passaged with TrypLE at 37°C for 5 min and plated into Matrigel or Geltrex-coated tissue culture vessels at a density of 35,000/cm2.
To initiate neuronal differentiation, NPCs at passages three to six were cultured in Matrigel or Geltrex-coated tissue culture vessels until 80–90% confluence. NPC medium was replaced with DM to start the NPC differentiation. After three days, cells were dissociated with papain and replated into PDL- (50 μg/mL) and iMatrix-coated tissue culture vessels (1:200 in dPBS) at 200,000 cells/cm2 in DM media supplemented with mitomycin C (0.25 μM) and DAPT (10 μM). Half media changes were performed every 3 or 4 days to differentiate and mature the neurons.
Targeted engineering to generate inducible NGN2 line
Kof2.1J line was thawed on Geltrex (1:50 in cold DMEM/F12) -coated 6-well plates and recovered till 70% confluency.
On engineering day 0, a 24-well plate was coated with Geltrex for 1 h mTeSR Plus was supplemented with 1x CloneR2 and 1x HDR Enhancer V2 (IDT) and added to the Geltrex-coated 24-well plate at 2mL per well and kept in a 32°C, 5% CO2 incubator. 2 wells were prepared for edited cells and no transfection control respectively.
4 μL sgRNA (125 pmol/μL in TE buffer) was mixed with 2 μL of HiFi Cas9 nuclease V3 (IDT) and incubated at room temperature for 30-45 min to form the RNP complex before electroporation. Cells were dissociated with Accutase as described in the previous section (50 μL/cm2, 10 min at 37oC), and 3 million cells/well were expected at this density. Cell survival rate should be above 95%. Two tubes of 1–1.5 million cells were pelleted. One tube was gently resuspended with 20ul supplemented P3 Primary Cell Nucleofector Solution (Lonza) and added to the pre-formed RNP complex. The donor plasmid (2ug at 1ug/ul, sequence provided in Data S3) was added immediately before transferring the entire mix to one well of a 16-well Nucleocuvette Strip (Lonza). The second pellet was resuspended with 20ul of P3 solution and directly transferred to a different well of the 16-well Nucleocuvette Strip. The two wells were electroporated in 4D-Nucleofector X Unit (Lonza) with program CM113. Immediately after nucleofection, the cells were diluted in 100 μL of the pre-warmed media from the 24-well plate and transferred back to the 24-well plate. The plate was immediately returned to the 32°C incubator.
On day 1, red fluorescence should be visible in approximately ⅓ of the cells in the transfected well and the well should be at least 50% confluent. Media was changed to mTeSR Plus without supplements and cells were returned to the 32°C incubator.
On day 2, the media was changed to mTeSR Plus containing 4 μg/mL Blasticidin and ClonR2 in both transfected well and control well. The plate was returned to a 37°C incubator for two days.
On day 4, all cells in the control well should have been killed. Cells from the transfected wells were dissociated with Accutase into single cells and plated into 4 × 10 cm dishes with serial 1:5 dilutions. The cells were cultured with mTeSR Plus supplemented with ClonR2 for 2 days before removing ClonR2 and cultured for another 3 days with media change every other day. Dishes were inspected for well-separated colonies with even red fluorescence.
On day 9, 4 μg/mL Blasticidin was added during media change. Cells were incubated for another two days.
On Day 11, 10 cm dishes were inspected for colony density– dishes with dense, fused colonies were dissociated with Accutase and cryopreserved with CryoStor CS10 and stored in a liquid nitrogen tank; dishes with well-separated colonies were used for colony picking under an EVOS M5000 microscope equipped with the red fluorescent cube. Colonies with smooth edges, even red fluorescence, and were well separated from other colonies were picked with a 200 μL pipette (set to 100 μL) with a tip attached. 3–4 chunks were transferred to one well of a 96-well plate coated with Geltrex and containing 100 μL mTeSR Plus (“expansion plate”). 3–4 chunks were transferred to one well of a 96-well plate coated with iMatrix-511 and containing mTeSR Plus with 6 μg/mL doxycycline (“phenotyping plate”). The remaining 3–4 chunks were transferred to an un-coated V-bottom 96-well plate where cells were pelleted for genotyping (“genotyping plate”). The expansion plate was fed every other day with mTeSR plus. The phenotyping plate was fed every day with NGN2 induction media. Cell pellets from the genotyping plate were processed with QuickExtract for gDNA extraction and PCR genotyped with Q5 Hot Start High-Fidelity 2X Master Mix. Colonies that successfully differentiated, passed genotyping, and did not develop strong mosaic fluorescent patterns were selected to proceed.
On day 18, positive colonies were passaged into one well of a 6-well plate coated with Geltrex to perform further QC and master stock generation. Cells should reach 50% or more confluency in 5–7 days.
Single nuclei RNA sequencing
Neurons were washed once with Ca2+, Mg2+ -free dPBS, and lifted as sheets from 6-well plates by incubating with Papain diluted in PBS for 5 min at 37°C. Lifted neurons were collected without dissociation using wide-bore pipette tips into microcentrifuge tubes and pelleted with 5 min, 300g centrifugation. The supernatant was aspirated and pellets were snap-frozen with liquid nitrogen and stored at −80°C until lysis.
cDNA libraries were prepared using “Chromium Next GEM Single Cell 3′ Reagent Kits v3.1” from 10x Genomics. In brief, cells were collected and nuclei were extracted using a 10x Genomics nuclei extraction buffer. 8000 nuclei were targeted for each of the samples. Single-nuclei droplets were generated using Chromium Connect.
Single-nuclei gene expression libraries were quantified with Qubit dsDNA HS Assay Kit (Thermo Fisher Scientific) and profiled using D1000 ScreenTape on TapeStation 4200 (Agilent Technologies). Libraries were pooled and sequenced on NovaSeq 6000 (Illumina) to generate a minimum of 20,000 read pairs per cell at a configuration of 28 base pairs of read 1 and 90 base pairs of read 2.
Preprocessing of snRNAseq
snRNAseq FASTQ files generated using either 10X single-cell gene expression or 10X single-cell multiome kits were processed with either CellRanger or CellRanger-Arc with default parameters. Count matrices were further preprocessed using the Seurat R package (v.4.3.0). For each sample, low-quality cells were initially filtered out with ≤1000 measured genes, and mitochondrial gene expression percentage ≥10%. Each sample’s counts were normalized via fitting a negative binomial model using the52,53 SCTransform function with default settings before performing PCA (RunPCA) and Louvain clustering (FindNeighbors, FindClusters, RunUMAP).
Dataset integration
Each sample’s QC-passing cells were merged into a single Seurat object and processed using the v2 SCTransform pipeline. Anchors from each dataset were identified using the reciprocal PCA approach.54 Differentially expressed genes (DEGs) were identified with corrected counts (PrepSCTFindMarkers) that had a minimum difference in the fraction of detection between the two groups of 0.25.
Bulk RNA sequencing
Neurons were washed once with Ca2+, Mg2+ -free dPBS. Total RNA was extracted with the RNeasy Plus RNA extraction kit following the manufacturer’s instructions and stored at −80°C before RNA sequencing.
Total RNA was quantified with Qubit RNA HS Assay Kit (Thermo Fisher Scientific) and quality was assessed using RNA ScreenTape on TapeStation 4200 (Agilent Technologies). For sequencing library generation, the Truseq Stranded mRNA kit (Illumina) was used with an input of 100–1000 ng of total RNA. Libraries were quantified with Qubit dsDNA HS Assay Kit (Thermo Fisher Scientific) and the average library size was determined using D1000 ScreenTape on TapeStation 4200 (Agilent Technologies). Libraries were pooled and sequenced on Illumina HiSeq 4000 (Illumina) to generate 30 million single-end 50-base pair reads for each sample.
Bulk RNAseq FASTQ data were aligned to the human reference genome (GRCh38) using the GSNAP aligner and HTSeqGenie pipeline as previously described.55 Gene expression was normalized with the nRPKM method, which is proportional to the size factor normalization of DESeq.55,56
Data analyses on bulk RNAseq were performed in R. Principal component analyses (PCA) were performed on the log(nRPKM+1) forms of the highly expressed (Max nRPKM>2) highly variable (CV > 0.25) genes, using the pca() function. Correlation analysis was performed using cor() function with the Spearman method. Gene ontology analyses were performed using enrichGO function in the clusterProfiler package. Differential expression analysis for the bulk RNAseq data was performed with Voom function.57 External snRNAseq data were processed using the Seurat pipeline. Pseudo-bulks were generated using aggregateAcrossCells function (scater) and PseudoBulkExperiment function (pokoteng.solo).
WGCNA analysis
WGCNA was performed on all bulk RNAseq samples using the standard workflow.58,59 Modules with cluster height below 0.25 were merged. Upon defining gene modules, Pearson correlation values were calculated between each module eigengene with the differentiation day of each sample to identify gene modules that are associated with neuronal maturation. To identify if the disease GWAS genes are significantly enriched in any gene modules, hypergeometric tests were performed with each GWAS gene set and each module gene set, and the Benjamini-Hochberg procedure was used to calculate the false discovery rate.
Derivation of maturation marker genes
Highly expressed (maximum Log2(nRPKM+1) > 2, nRPKM: normalized Reads Per Kilobase Million), highly variable (CV > 0.25, CV: coefficient of variation) genes whose RNA expression correlated with the differentiation days (Spearman correlation value >0.9) were selected for further analysis (1,593 genes).
Out of the 1,593 genes, 747 were shared by the RNA and protein datasets (day 56 vs. day 28). The log fold changes (day 56 vs. day 28) in the proteomics and RNAseq data in the 1,593 genes were compared. Genes whose protein trend was inconsistent with the RNA trend (RNA trending up while protein trending down or vice versa) were excluded, yielding 688 genes.
Differential expression analysis between Pd86 (most correlated with day 56) and Gw22 (most correlated with day 14) in the Lister dataset was performed to compare with the NGN2 iN RNAseq data (day 56 vs. day 14). Among the candidate 688 genes, 181 were found in the in vivo snRNA dataset. Genes that fell within quadrants 1 and 3 in the LogFC vs. LogFC graph followed the same direction of trends in vitro and in vivo. The in vivo expression patterns at multiple time points were further checked to ensure that they were consistently trending up or down, yielding the 117 maturation genes.
Derivation of maturation scores
Corrective Coefficients were calculated to offset the dominant effects of highly expressed or highly dynamic genes. To represent the dynamic range of each gene, day 56/day 14-fold changes were calculated for the up genes and day 14/day 56 were calculated for the down genes (). For baseline expression, the minimum nRPKM of each gene in the NGN2 iN bulk RNAseq data was used: . To calculate the Corrective Coefficient of each gene, the two numbers were multiplied, reciprocated, and assigned positive to the coefficients of the up genes and negative to those of the down genes (). In summary:
MS-117s were calculated with each marker gene’s expression value (nRPKM) corrected by multiplying their RNA level in the testing samples with their Corrective Coefficient.
MS-NSs were calculated by further correcting each neuron-specific (NS) gene’s RNA level by dividing it with the RNA level of CNR1 in each testing sample.
Proteomics
Sample preparation
Neurons were washed once with Ca2+, Mg2+ -free dPBS, and lifted as sheets from 6-well plates by incubating with EDTA (2 μM) diluted in Ca2+, Mg2+ -free dPBS for 5 min at 37°C. Lifted neurons were collected without dissociation using wide-bore pipette tips into microcentrifuge tubes and pelleted with 5 min, 300g centrifugation. Liquid was aspirated and pellets were snap-frozen with liquid nitrogen and stored at −80°C until lysis.
Cell pellets were lysed in buffer containing 8 M urea, 150 mM NaCl, 50 mM HEPES (pH 8.0), one complete-mini (EDTA free) protease inhibitor (ROCHE) tablet, and one phosphatase inhibitor (PHOSstop) tablet (ROCHE) were supplemented per 10 mL lysis buffer. Lysates were centrifugated (18,000 x g, 15 min) to remove insoluble material, and the protein concentrations were then determined by BCA. 120 μg of lysate per sample were reduced (4.1 mM dithiothreitol, 60 min at 37°C) and alkylated (9.1 mM iodoacetamide, 15 min at room temperature), diluted 4-fold and subjected to overnight enzymatic digestion at 37°C with a combination of lysyl-endopeptidase (Wako) and sequencing grade trypsin (Promega), both at an enzyme to protein ratio of 1:50, the latter of which was added to the sample 3 h post incubation with the former. Resultant peptides were acidified with 20% TFA to a final concentration of 1% and clarified via high-speed centrifugation (18,000 x g, 10 min) prior to desalting via SOLA HRP solid phase extraction (Thermo) and lyophilization for 24 h.
Each sample was resuspended with 100 μL of 100 mM HEPES pH 8.0 and labeled with a full vial of TMTpro 18-plex labeling reagent (Thermo) for 1 h. The reaction was quenched by the addition of 5 μL of 5% hydroxylamine (15 min at room temperature), combined and desalted by C18 Sep-Pak (Waters) solid phase extraction, and the eluents were dried to completion.
The TMT-labeled sample was resuspended in 0.15% trifluoroacetic acid and subjected to centrifugation at 16,000 x g to remove insoluble material with the supernatant taken forward for offline high pH reversed-phase liquid chromatography separation on an Agilent 1100 series HPLC system. Peptides were loaded onto an Agilent Zorbax 300 Extend C-18 analytical column (2.1 × 150 mm and 3.5 μM particle size, Part No: 763750-902). Solvent A consisted of 25 mM Ammonium Formate (pH 9.7), while solvent B was 100% acetonitrile. Peptide fractions were collected in 45 s intervals for a total of 63 min with a linear gradient of 15–60% solvent B. In total 96 fractions were collected and every 25th fraction was combined to form a final set of 24 fractions. Samples were dried in a speedvac, desalted using C18 StageTips as previously described, and injected for nLC-MS/MS analysis.56,60
nLC-MS/MS analysis
Each sample was reconstituted in 2% acetonitrile (ACN)/0.1% formic acid (FA) and analyzed by nLC-MS/MS on a Dionex UltiMate 3000 RSLCnano Proflow system (Thermo Fisher Scientific) connected to an Orbitrap Eclipse mass spectrometer (Thermo Fisher Scientific). Peptides were loaded onto an Aurora Series 25 cm × 75 μM I.D. column (IonOpticks) and separated at a flow rate of 300 nL/min over a two-stage linear gradient where buffer B (98% ACN, 2% H2O, 0.1% formic acid) increased from 4% to 30% over 70 min and then from 30% to 75% over 4.9 min with an overall method time of 95 min. SPS-MS3 was implemented for improved quantitative accuracy.61,62 For these analyses, a real-time search against a human database (version 2017_08 that includes 42,215 Swissprot sequences of canonical and protein isoforms and 140,036 unreviewed TREMBL sequences) was employed using the capabilities built within the XCalibur method editor. For all runs, intact peptides were surveyed in the Orbitrap (250% normalized AGC target, 120,000 resolution) and peptides selected for MS2 fragmentation (150% normalized AGC target; CID, 30 NCE) were analyzed in the ion trap. Quantitative MS3 scans were performed by selection of the 8 most abundant fragment ions from MS2 spectra and fragmentation at high energy (HCD, 40 NCE) to produce reporter mass ions that were analyzed in the Orbitrap (30,000 resolution).
Quantification and statistical analysis of the proteomics data
Quantification and statistical testing of global proteomics data were performed by MSstatsTMT v2.6.0, an open-source R/Bioconductor package.63 MSstatsTMT was used to create quantification reports and statistical testing reports using the Peptide Spectrum Matches (PSM) as described above. First, PSMs were filtered out if they were (1) from decoy proteins; (2) from peptides with length less than 7; (3) with isolation specificity less than 70%; (4) with reporter ion intensity less than 28 noise estimate; (5) from peptides shared by more than one protein; (6) with summed reporter ion intensity (across all eleven channels) lower than 30,000. In the case of redundant PSMs (i.e., multiple PSMs in one MS run corresponding to the same peptide ion), only the single PSM with the least missing values or highest isolation specificity or highest maximal reporter ion intensity was retained for subsequent analysis. 24 fractions from the same TMT mixture were combined in MSstatsTMT. In particular, if the same peptide ion was identified in multiple fractions, only the single fraction with the highest mean or maximal reporter ion intensity was kept. Next, MSstatsTMT generated a normalized quantification report across all the samples at the protein level from the processed PSM report. Global median normalization, which equalized the median of the reporter ion intensities across all the channels, was carried out to reduce the systematic bias between channels. The normalized reporter ion intensities of all the peptide ions mapped to a protein were summarized into a single protein level intensity in each channel and TMT mixture by MSstats v4.2.0.64 As a final step, the differential abundance analysis between conditions was performed in MSstatsTMT based on a linear mixed effects model per protein. The inference procedure was adjusted by applying an empirical Bayes shrinkage. To test the two-sided null hypothesis of no changes in abundance, the model-based test statistics were compared to the Student’s t t-test distribution with the degrees of freedom appropriate for each protein. The resulting p values were adjusted to control the FDR with the method by Benjamini-Hochberg.65
Immunofluorescence (IF)
All IF cells were cultured on 96-well imaging plates. Neurons were fixed by adding 50 μL 16% formaldehyde per well containing 150 μL media and incubating at room temperature for 10 min. Fixation was stopped by washing with PBS +0.1% Triton X-100 (wash buffer). Blocking was performed by incubating the fixed cells with the wash buffer +3% BSA (blocking buffer) at room temperature for 30 min. Then, primary antibodies (see key resources table) were diluted in the blocking buffer and incubated with cells at 4°C overnight. Cells were washed with the wash buffer and incubated with secondary antibodies (see key resources table) diluted in the blocking buffer for 2 h before being washed again. DAPI diluted in PBS (5 μg/mL) was added to the samples before imaging was performed.
Imaging and analysis
Images were acquired on Echo Revolve fluorescent microscope (10x images, Figure 1), Zeiss 980 AiryScan (63x confocal mode, Figure 5A), or ImageXpress Micro confocal high-content imaging system (40x, Figure 6A). For high-content imaging, 9 z stack images were acquired per sample. Max projections of each image were exported for data analysis.
A model based on the cyto model (cellpose) was iteratively trained to recognize MAP2+ soma. This model was then imported to a CellProfiler analysis pipeline (Data S1) that can be described briefly as the following: first, HOMER1 and VGLUT1 puncta were segmented by the identified primary object model. Next, MAP2 grayscale images were converted to a binary image by the threshold module, and MAP2 positive areas were measured by the measure image area occupied module. Only puncta that overlaid with MAP2 were kept. MAP2 was then marked by keeping puncta where MAP2 and VGLUT1 overlaid. Finally, MAP2 somata were segmented with the run cellpose module with the previously trained model, and all measurements were normalized by the MAP2 soma counts.
Patch clamping
Day 5 neurons were plated at 100,000 cells/cm2 on low-profile imaging dishes coated with PDL and iMatrix-511 as described above. Cells were fed with DM two times a week till recording.
Patch clamp recordings were performed using a Multiclamp 700B amplifier and pClamp10 acquisition software (Molecular Devices), and then filtered at 2 kHz (voltage clamp) or 10 kHz (current clamp) and digitized at 10 kHz using a Digidata 1440 analog-to-digital converter (Molecular Devices). For testing neural excitability, iNeurons were current-clamped at −65 mV. A series of 15–20 current steps were injected for 1 s, which started at −20 pA at 10 pA increments. The intracellular solution for current clamp recordings contained the following: 130 mM K-gluconate, 5 mM NaCl, 10 mM HEPES, 0.2 mM EGTA, 2 mM MgCl2, 4 mM Na-ATP, 0.5 Mg-GTP pH 7.3. For testing functional synaptic connections, iNeuron were voltage clamped at −70 mV, and spontaneous excitatory postsynaptic currents (sEPSC) were recorded for 1 min. If no event was observed in the first minute, the neuron was recorded for an additional minute to confirm. The intracellular solution voltage-clamp recordings contained the following: 130 mM CsMeSO3, 4 mM NaCl, 10 mM HEPES, 0.2 mM EGTA, 5 mM QX-314 Br, 4 mM Na-ATP, and 0.5 mM Mg-GTP, pH 7.3.
Recording electrodes with an open tip resistance of 4–8 MOhm were used for recordings. The recording chamber was perfused continuously with oxygenated ACSF contained the following: 127 mM NaCl, 2.5 mM KCl, 1.25 mM NaHPO4, 25 mM Na2CO3, 25 mM Glucose, 2.5 mM Ca2+, 1.3 mM Mg2+ for current clamp recordings. For sEPSC recordings, neuronal excitability and synaptic vesicle release probability were increased by raising KCl to 5 mM and Ca2+ to 4 mM with no Mg2+ in ACSF in order to facilitate the detection of functional synaptic connections and accommodate for the low degree of synaptic connectivity in neurons at early time points. All the recordings were analyzed using Easy Electrophysiology software (v2.6, Cambridge, UK). Rheobase was defined as the minimum current step that triggers action potential firing and hence the resolution is 10 pA. The max firing rate was calculated at the current step that triggers maximum numbers of action potentials with no failures. Action potential half-widths was calculated from the first action potential at rheobase. sEPSC frequency and amplitude were analyzed from the median 25 events (ranging from 2 to 338 events) if any event was detected during the recording time frame. Example recordings were plotted using custom Python scripts.
Multiple electrode array (MEA) recordings
MaxTwo 6-well plates (Maxwell biosystems) were cleaned, de-contaminated, and conditioned following the manufacturer’s instructions. Chips were coated with PDL (250 μg/mL) and iMatrix-511 (1:100 in dPBS). Day 5 NGN2 neurons were plated at 750,000 in 50 μL liquid drops covering the entire chip. On the next day, 1 mL of media per well was added. Cells were then maintained as described above.
MEA recordings were performed on a MaxTwo high-density microelectrode array system (Maxwell biosystems) at 37°C. Recording parameters were set as follows: Gain 512x, HPF ∼300 Hz, spike threshold 5.00 (default values).
Western blotting
Cells were washed twice with DPBS at room temperature (RT), lysed with 1X RIPA Lysis and Extraction Buffer (ThermoFisher Scientific), 1X Halt Protease Inhibitor Cocktail, (Thermo Scientific). Lysis was incubated on ice for 5 min before cells were scraped and transferred to microcentrifuge tubes on ice and incubated for an additional 30 min. Lysates were then spun at 20,000xg for 15 min to pellet cellular debris, and the supernatant was collected and stored at −80°C until processing.
The total protein concentration of lysates was quantified using the Pierce BCA Protein Assay Kit (Thermo Scientific, cat. No. 23225). To dephosphorylate proteins, samples were incubated with Lambda Protein Phosphatase (NEB, Cat. No. 0753) according to the manufacturer’s instructions at 30°C for 3 h. Dephosphorylated lysates were thawed on ice and 10μg of total protein were mixed 3:1 with 4X NuPAGE LDS Sample Buffer (ThremoFisher Scientific), 9:1 with 10X NuPAGE Sample Reducing Agent (ThermoFisher Scientific), and then incubated at 70°C for 10 min. 1X SDS Running buffer was prepared by adding 50mL 20X NuPAGE MOPS SDS Running Buffer to 950 mL of deionized water and 2.5 mL of NuPAGE Antioxidant. Tau Ladder (Sigma-Aldrich) and protein samples were loaded and separated on a NuPAGE 4 to 12% precast gel (Invitrogen) and then transferred onto a 0.2 μm nitrocellulose membrane (Bio-RAD). Membranes were blocked with 5% BSA in 1X TBST buffer for 1 h at RT on a rocking shaker. Primary antibodies, Tau 1:5000 (DAKO, A0024), 2N Tau 1:1000 (Abcam, ab218316), and β-actin 1:5000 (MiliporeSigma, A1978), were diluted in the blocking buffer and incubated overnight at 4°C on a rocking shaker. Secondary antibodies, IRDye 680RD Goat Anti-Mouse (Licor) and IRDye 800CW Donkey Anti-Rabbit (Licor) were diluted 1:10,000 in blocking buffer and incubated for 1 h at RT on a shaker. Blots were washed three times in 1X TBST buffer and imaged on the Odyssey DLx scanner (Li-COR Biosciences).
Quantification and statistical analysis
ANOVAs with Tukey HSD and T-tests were performed with Prism-GraphPad or R. Spearman correlation analyses were performed with R. For all statistical analyses, the significance limit is set at 0.05 for p-values or False Discovery Rate/Adjusted p-values when available.
Published: September 9, 2024
Footnotes
Supplemental information can be found online at https://doi.org/10.1016/j.crmeth.2024.100858.
Supplemental information
Table lists the function snippet, corrective coefficient, and cell-type enrichment information on each neuronal maturation marker gene and the maturation loading control gene CNR1. Related to Figure 3G, 3H, and 4F.
When AraC was omitted or Y-27632 was included, cells with progenitor morphology migrate and clump together.
References
- 1.Burke E.E., Chenoweth J.G., Shin J.H., Collado-Torres L., Kim S.-K., Micali N., Wang Y., Colantuoni C., Straub R.E., Hoeppner D.J., et al. Dissecting transcriptomic signatures of neuronal differentiation and maturation using iPSCs. Nat. Commun. 2020;11:462. doi: 10.1038/s41467-019-14266-z. [DOI] [PMC free article] [PubMed] [Google Scholar]
- 2.van de Leemput J., Boles N.C., Kiehl T.R., Corneo B., Lederman P., Menon V., Lee C., Martinez R.A., Levi B.P., Thompson C.L., et al. CORTECON: a temporal transcriptome analysis of in vitro human cerebral cortex development from human embryonic stem cells. Neuron. 2014;83:51–68. doi: 10.1016/j.neuron.2014.05.013. [DOI] [PubMed] [Google Scholar]
- 3.Strano A., Tuck E., Stubbs V.E., Livesey F.J. Variable Outcomes in Neural Differentiation of Human PSCs Arise from Intrinsic Differences in Developmental Signaling Pathways. Cell Rep. 2020;31 doi: 10.1016/j.celrep.2020.107732. [DOI] [PMC free article] [PubMed] [Google Scholar]
- 4.Volpato V., Webber C. Addressing variability in iPSC-derived models of human disease: guidelines to promote reproducibility. Dis. Model. Mech. 2020;13 doi: 10.1242/dmm.042317. [DOI] [PMC free article] [PubMed] [Google Scholar]
- 5.Hulme A.J., Maksour S., St-Clair Glover M., Miellet S., Dottori M. Making neurons, made easy: The use of Neurogenin-2 in neuronal differentiation. Stem Cell Rep. 2022;17:14–34. doi: 10.1016/j.stemcr.2021.11.015. [DOI] [PMC free article] [PubMed] [Google Scholar]
- 6.Zhang Y., Pak C., Han Y., Ahlenius H., Zhang Z., Chanda S., Marro S., Patzke C., Acuna C., Covy J., et al. Rapid single-step induction of functional neurons from human pluripotent stem cells. Neuron. 2013;78:785–798. doi: 10.1016/j.neuron.2013.05.029. [DOI] [PMC free article] [PubMed] [Google Scholar]
- 7.Chen M., Maimaitili M., Habekost M., Gill K.P., Mermet-Joret N., Nabavi S., Febbraro F., Denham M. Rapid generation of regionally specified CNS neurons by sequential patterning and conversion of human induced pluripotent stem cells. Stem Cell Res. 2020;48 doi: 10.1016/j.scr.2020.101945. [DOI] [PubMed] [Google Scholar]
- 8.Nehme R., Zuccaro E., Ghosh S.D., Li C., Sherwood J.L., Pietilainen O., Barrett L.E., Limone F., Worringer K.A., Kommineni S., et al. Combining NGN2 Programming with Developmental Patterning Generates Human Excitatory Neurons with NMDAR-Mediated Synaptic Transmission. Cell Rep. 2018;23:2509–2523. doi: 10.1016/j.celrep.2018.04.066. [DOI] [PMC free article] [PubMed] [Google Scholar]
- 9.Schmid B., Holst B., Poulsen U., Jørring I., Clausen C., Rasmussen M., Mau-Holzmann U.A., Steeg R., Nuthall H., Ebneth A., Cabrera-Socorro A. Generation of two gene edited iPSC-lines carrying a DOX-inducible NGN2 expression cassette with and without GFP in the AAVS1 locus. Stem Cell Res. 2021;52 doi: 10.1016/j.scr.2021.102240. [DOI] [PubMed] [Google Scholar]
- 10.Fernandopulle M.S., Prestil R., Grunseich C., Wang C., Gan L., Ward M.E. Transcription Factor-Mediated Differentiation of Human iPSCs into Neurons. Curr. Protoc. Cell Biol. 2018;79 doi: 10.1002/cpcb.51. [DOI] [PMC free article] [PubMed] [Google Scholar]
- 11.Wang C., Ward M.E., Chen R., Liu K., Tracy T.E., Chen X., Xie M., Sohn P.D., Ludwig C., Meyer-Franke A., et al. Scalable Production of iPSC-Derived Human Neurons to Identify Tau-Lowering Compounds by High-Content Screening. Stem Cell Rep. 2017;9:1221–1233. doi: 10.1016/j.stemcr.2017.08.019. [DOI] [PMC free article] [PubMed] [Google Scholar]
- 12.Limone F., Guerra San Juan I., Mitchell J.M., Smith J.L.M., Raghunathan K., Meyer D., Ghosh S.D., Couto A., Klim J.R., Joseph B.J., et al. Efficient generation of lower induced motor neurons by coupling Ngn2 expression with developmental cues. Cell Rep. 2023;42 doi: 10.1016/j.celrep.2022.111896. [DOI] [PMC free article] [PubMed] [Google Scholar]
- 13.Lin H.-C., He Z., Ebert S., Schörnig M., Santel M., Nikolova M.T., Weigert A., Hevers W., Kasri N.N., Taverna E., et al. NGN2 induces diverse neuron types from human pluripotency. Stem Cell Rep. 2021;16:2118–2127. doi: 10.1016/j.stemcr.2021.07.006. [DOI] [PMC free article] [PubMed] [Google Scholar]
- 14.Bardy C., van den Hurk M., Kakaradov B., Erwin J.A., Jaeger B.N., Hernandez R.V., Eames T., Paucar A.A., Gorris M., Marchand C., et al. Predicting the functional states of human iPSC-derived neurons with single-cell RNA-seq and electrophysiology. Mol. Psychiatr. 2016;21:1573–1588. doi: 10.1038/mp.2016.158. [DOI] [PMC free article] [PubMed] [Google Scholar]
- 15.Fitsch H., Lysen F., Choudhury S. Frontiers Media SA; 2022. Challenges of Interdisciplinary Research in the Field of Critical (Sex/Gender) Neuroscience. [DOI] [PMC free article] [PubMed] [Google Scholar]
- 16.Baum C. Insertional mutagenesis in gene therapy and stem cell biology. Curr. Opin. Hematol. 2007;14:337–342. doi: 10.1097/MOH.0b013e3281900f01. [DOI] [PubMed] [Google Scholar]
- 17.Manos J.D., Preiss C.N., Venkat N., Tamm J., Reinhardt P., Kwon T., Wu J., Winter A.D., Jahn T.R., Yanamandra K., et al. Uncovering specificity of endogenous TAU aggregation in a human iPSC-neuron TAU seeding model. iScience. 2022;25 doi: 10.1016/j.isci.2021.103658. [DOI] [PMC free article] [PubMed] [Google Scholar]
- 18.Schörnig M., Ju X., Fast L., Ebert S., Weigert A., Kanton S., Schaffer T., Nadif Kasri N., Treutlein B., Peter B.M., et al. Comparison of induced neurons reveals slower structural and functional maturation in humans than in apes. Elife. 2021;10 doi: 10.7554/eLife.59323. [DOI] [PMC free article] [PubMed] [Google Scholar]
- 19.Ang C.E., Olmos V.H., Vodehnal K., Zhou B., Lee Q.Y., Sinha R., Narayanaswamy A., Mall M., Chesnov K., Dominicus C.S., et al. Generation of human excitatory forebrain neurons by cooperative binding of proneural NGN2 and homeobox factor EMX1. Proc. Natl. Acad. Sci. USA. 2024;121 doi: 10.1073/pnas.2308401121. [DOI] [PMC free article] [PubMed] [Google Scholar]
- 20.Wang J., Ou S.-W., Wang Y.-J. Distribution and function of voltage-gated sodium channels in the nervous system. Channels. 2017;11:534–554. doi: 10.1080/19336950.2017.1380758. [DOI] [PMC free article] [PubMed] [Google Scholar]
- 21.Deng L., Dourado M., Reese R.M., Huang K., Shields S.D., Stark K.L., Maksymetz J., Lin H., Kaminker J.S., Jung M., et al. Nav1.7 is essential for nociceptor action potentials in the mouse in a manner independent of endogenous opioids. Neuron. 2023;111:2642–2659.e13. doi: 10.1016/j.neuron.2023.05.024. [DOI] [PubMed] [Google Scholar]
- 22.Herring C.A., Simmons R.K., Freytag S., Poppe D., Moffet J.J.D., Pflueger J., Buckberry S., Vargas-Landin D.B., Clément O., Echeverría E.G., et al. Human prefrontal cortex gene regulatory dynamics from gestation to adulthood at single-cell resolution. Cell. 2022;185:4428–4447.e28. doi: 10.1016/j.cell.2022.09.039. [DOI] [PubMed] [Google Scholar]
- 23.Das D., Sonthalia S., Stein-O ’Brien G., Wahbeh M.H., Feuer K., Goff L., Colantuoni C., Mahairaki V., Avramopoulos D. Insights for disease modeling from single-cell transcriptomics of iPSC-derived Ngn2-induced neurons and astrocytes across differentiation time and co-culture. BMC Biol. 2024;22:75. doi: 10.1186/s12915-024-01867-4. [DOI] [PMC free article] [PubMed] [Google Scholar]
- 24.Bar-Shira O., Maor R., Chechik G. Gene Expression Switching of Receptor Subunits in Human Brain Development. PLoS Comput. Biol. 2015;11 doi: 10.1371/journal.pcbi.1004559. [DOI] [PMC free article] [PubMed] [Google Scholar]
- 25.Halls M.L., Cooper D.M.F. Regulation by Ca2+-signaling pathways of adenylyl cyclases. Cold Spring Harbor Perspect. Biol. 2011;3 doi: 10.1101/cshperspect.a004143. [DOI] [PMC free article] [PubMed] [Google Scholar]
- 26.LaForce G.R., Philippidou P., Schaffer A.E. Vol. 14. Wiley Interdiscip. Rev. RNA; 2023. mRNA isoform balance in neuronal development and disease. [DOI] [PMC free article] [PubMed] [Google Scholar]
- 27.Li M., Santpere G., Imamura Kawasawa Y., Evgrafov O.V., Gulden F.O., Pochareddy S., Sunkin S.M., Li Z., Shin Y., Zhu Y., et al. Integrative functional genomic analysis of human brain development and neuropsychiatric risks. Science. 2018;362 doi: 10.1126/science.aat7615. [DOI] [PMC free article] [PubMed] [Google Scholar]
- 28.Berg J., Sorensen S.A., Ting J.T., Miller J.A., Chartrand T., Buchin A., Bakken T.E., Budzillo A., Dee N., Ding S.-L., et al. Human neocortical expansion involves glutamatergic neuron diversification. Nature. 2021;598:151–158. doi: 10.1038/s41586-021-03813-8. [DOI] [PMC free article] [PubMed] [Google Scholar]
- 29.Moradi Chameh H., Rich S., Wang L., Chen F.-D., Zhang L., Carlen P.L., Tripathy S.J., Valiante T.A. Diversity amongst human cortical pyramidal neurons revealed via their sag currents and frequency preferences. Nat. Commun. 2021;12 doi: 10.1038/s41467-021-22741-9. [DOI] [PMC free article] [PubMed] [Google Scholar]
- 30.Ciganok-Hückels N., Jehasse K., Kricsfalussy-Hrabár L., Ritter M., Rüland T., Kampa B.M. Postnatal development of electrophysiological and morphological properties in layer 2/3 and layer 5 pyramidal neurons in the mouse primary visual cortex. Cerebr. Cortex. 2022;33:5875–5884. doi: 10.1093/cercor/bhac467. [DOI] [PMC free article] [PubMed] [Google Scholar]
- 31.Valiullina F., Akhmetshina D., Nasretdinov A., Mukhtarov M., Valeeva G., Khazipov R., Rozov A. Developmental Changes in Electrophysiological Properties and a Transition from Electrical to Chemical Coupling between Excitatory Layer 4 Neurons in the Rat Barrel Cortex. Front. Neural Circ. 2016;10:1. doi: 10.3389/fncir.2016.00001. [DOI] [PMC free article] [PubMed] [Google Scholar]
- 32.Livesey M.R., Magnani D., Hardingham G.E., Chandran S., Wyllie D.J.A. Functional properties of in vitro excitatory cortical neurons derived from human pluripotent stem cells. J. Physiol. 2016;594:6573–6582. doi: 10.1113/JP270660. [DOI] [PMC free article] [PubMed] [Google Scholar]
- 33.Boehler M.D., Wheeler B.C., Brewer G.J. Added astroglia promote greater synapse density and higher activity in neuronal networks. Neuron Glia Biol. 2007;3:127–140. doi: 10.1017/S1740925X07000440. [DOI] [PMC free article] [PubMed] [Google Scholar]
- 34.Shan L., Zhang T., Fan K., Cai W., Liu H. Astrocyte-Neuron Signaling in Synaptogenesis. Front. Cell Dev. Biol. 2021;9 doi: 10.3389/fcell.2021.680301. [DOI] [PMC free article] [PubMed] [Google Scholar]
- 35.Bardy C., van den Hurk M., Eames T., Marchand C., Hernandez R.V., Kellogg M., Gorris M., Galet B., Palomares V., Brown J., et al. Neuronal medium that supports basic synaptic functions and activity of human neurons in vitro. Proc. Natl. Acad. Sci. USA. 2015;112:E2725–E2734. doi: 10.1073/pnas.1504393112. [DOI] [PMC free article] [PubMed] [Google Scholar]
- 36.Arpi M.N.T., Simpson T.I. SFARI genes and where to find them; modelling Autism Spectrum Disorder specific gene expression dysregulation with RNA-seq data. Sci. Rep. 2022;12 doi: 10.1038/s41598-022-14077-1. [DOI] [PMC free article] [PubMed] [Google Scholar]
- 37.Buniello A., MacArthur J.A.L., Cerezo M., Harris L.W., Hayhurst J., Malangone C., McMahon A., Morales J., Mountjoy E., Sollis E., et al. The NHGRI-EBI GWAS Catalog of published genome-wide association studies, targeted arrays and summary statistics 2019. Nucleic Acids Res. 2019;47:D1005–D1012. doi: 10.1093/nar/gky1120. [DOI] [PMC free article] [PubMed] [Google Scholar]
- 38.Verheyen A., Diels A., Dijkmans J., Oyelami T., Meneghello G., Mertens L., Versweyveld S., Borgers M., Buist A., Peeters P., Cik M. Using Human iPSC-Derived Neurons to Model TAU Aggregation. PLoS One. 2015;10 doi: 10.1371/journal.pone.0146127. [DOI] [PMC free article] [PubMed] [Google Scholar]
- 39.Rösler T.W., Tayaranian Marvian A., Brendel M., Nykänen N.-P., Höllerhage M., Schwarz S.C., Hopfner F., Koeglsperger T., Respondek G., Schweyer K., et al. Four-repeat tauopathies. Prog. Neurobiol. 2019;180 doi: 10.1016/j.pneurobio.2019.101644. [DOI] [PubMed] [Google Scholar]
- 40.Gaj T., Staahl B.T., Rodrigues G.M.C., Limsirichai P., Ekman F.K., Doudna J.A., Schaffer D.V. Targeted gene knock-in by homology-directed genome editing using Cas9 ribonucleoprotein and AAV donor delivery. Nucleic Acids Res. 2017;45 doi: 10.1093/nar/gkx154. [DOI] [PMC free article] [PubMed] [Google Scholar]
- 41.Song F., Stieger K. Optimizing the DNA Donor Template for Homology-Directed Repair of Double-Strand Breaks. Mol. Ther. Nucleic Acids. 2017;7:53–60. doi: 10.1016/j.omtn.2017.02.006. [DOI] [PMC free article] [PubMed] [Google Scholar]
- 42.Skarnes W.C., Pellegrino E., McDonough J.A. Improving homology-directed repair efficiency in human stem cells. Methods. 2019;164–165:18–28. doi: 10.1016/j.ymeth.2019.06.016. [DOI] [PubMed] [Google Scholar]
- 43.Steyer B., Bu Q., Cory E., Jiang K., Duong S., Sinha D., Steltzer S., Gamm D., Chang Q., Saha K. Scarless Genome Editing of Human Pluripotent Stem Cells via Transient Puromycin Selection. Stem Cell Rep. 2018;10:642–654. doi: 10.1016/j.stemcr.2017.12.004. [DOI] [PMC free article] [PubMed] [Google Scholar]
- 44.Bradke F., Di Giovanni S., Fawcett J. Neuronal Maturation: Challenges and Opportunities in a Nascent Field (2020) Trends Neurosci. 2020;43:360–362. doi: 10.1016/j.tins.2020.02.005. [DOI] [PubMed] [Google Scholar]
- 45.Liu Y., Kim D., Choi N., Oh J., Ha J., Zhou J., Zheng X., Shen H. hnRNP A1 Regulates Alternative Splicing of Tau Exon 10 by Targeting 3’ Splice Sites. Cells. 2020;9 doi: 10.3390/cells9040936. [DOI] [PMC free article] [PubMed] [Google Scholar]
- 46.Batenburg K.L., Sestito C., Cornelissen-Steijger P., van Weering J.R.T., Price L.S., Heine V.M., Scheper W. A 3D human co-culture to model neuron-astrocyte interactions in tauopathies. Biol. Proced. Online. 2023;25:4. doi: 10.1186/s12575-023-00194-2. [DOI] [PMC free article] [PubMed] [Google Scholar]
- 47.Guttikonda S.R., Sikkema L., Tchieu J., Saurat N., Walsh R.M., Harschnitz O., Ciceri G., Sneeboer M., Mazutis L., Setty M., et al. Fully defined human pluripotent stem cell-derived microglia and tri-culture system model C3 production in Alzheimer’s disease. Nat. Neurosci. 2021;24:343–354. doi: 10.1038/s41593-020-00796-z. [DOI] [PMC free article] [PubMed] [Google Scholar]
- 48.Nikolakopoulou P., Rauti R., Voulgaris D., Shlomy I., Maoz B.M., Herland A. Recent progress in translational engineered in vitro models of the central nervous system. Brain. 2020;143:3181–3213. doi: 10.1093/brain/awaa268. [DOI] [PMC free article] [PubMed] [Google Scholar]
- 49.Chen W., Shieh C., Swanger S.A., Tankovic A., Au M., McGuire M., Tagliati M., Graham J.M., Madan-Khetarpal S., Traynelis S.F., et al. GRIN1 mutation associated with intellectual disability alters NMDA receptor trafficking and function. J. Hum. Genet. 2017;62:589–597. doi: 10.1038/jhg.2017.19. [DOI] [PMC free article] [PubMed] [Google Scholar]
- 50.Barthet G., Shioi J., Shao Z., Ren Y., Georgakopoulos A., Robakis N.K. Inhibitors of γ-secretase stabilize the complex and differentially affect processing of amyloid precursor protein and other substrates. Faseb. J. 2011;25:2937–2946. doi: 10.1096/fj.11-183806. [DOI] [PMC free article] [PubMed] [Google Scholar]
- 51.Breunig J.J., Silbereis J., Vaccarino F.M., Sestan N., Rakic P. Notch regulates cell fate and dendrite morphology of newborn neurons in the postnatal dentate gyrus. Proc. Natl. Acad. Sci. USA. 2007;104:20558–20563. doi: 10.1073/pnas.0710156104. [DOI] [PMC free article] [PubMed] [Google Scholar]
- 52.Choudhary S., Satija R. Comparison and evaluation of statistical error models for scRNA-seq. Genome Biol. 2022;23:27. doi: 10.1186/s13059-021-02584-9. [DOI] [PMC free article] [PubMed] [Google Scholar]
- 53.Hafemeister C., Satija R. Normalization and variance stabilization of single-cell RNA-seq data using regularized negative binomial regression. Genome Biol. 2019;20:296. doi: 10.1186/s13059-019-1874-1. [DOI] [PMC free article] [PubMed] [Google Scholar]
- 54.Hao Y., Stuart T., Kowalski M.H., Choudhary S., Hoffman P., Hartman A., Srivastava A., Molla G., Madad S., Fernandez-Granda C., Satija R. Dictionary learning for integrative, multimodal and scalable single-cell analysis. Nat. Biotechnol. 2024;42:293–304. doi: 10.1038/s41587-023-01767-y. [DOI] [PMC free article] [PubMed] [Google Scholar]
- 55.Srinivasan K., Friedman B.A., Larson J.L., Lauffer B.E., Goldstein L.D., Appling L.L., Borneo J., Poon C., Ho T., Cai F., et al. Untangling the brain’s neuroinflammatory and neurodegenerative transcriptional responses. Nat. Commun. 2016;7 doi: 10.1038/ncomms11295. [DOI] [PMC free article] [PubMed] [Google Scholar]
- 56.Love M.I., Huber W., Anders S. Moderated estimation of fold change and dispersion for RNA-seq data with DESeq2. Genome Biol. 2014;15:550. doi: 10.1186/s13059-014-0550-8. [DOI] [PMC free article] [PubMed] [Google Scholar]
- 57.Law C.W., Chen Y., Shi W., Smyth G.K. voom: Precision weights unlock linear model analysis tools for RNA-seq read counts. Genome Biol. 2014;15:R29. doi: 10.1186/gb-2014-15-2-r29. [DOI] [PMC free article] [PubMed] [Google Scholar]
- 58.Zhang B., Horvath S. A general framework for weighted gene co-expression network analysis. Stat. Appl. Genet. Mol. Biol. 2005;4 doi: 10.2202/1544-6115.1128. [DOI] [PubMed] [Google Scholar]
- 59.Langfelder P., Horvath S. WGCNA: an R package for weighted correlation network analysis. BMC Bioinf. 2008;9:559. doi: 10.1186/1471-2105-9-559. [DOI] [PMC free article] [PubMed] [Google Scholar]
- 60.Rappsilber J., Mann M., Ishihama Y. Protocol for micro-purification, enrichment, pre-fractionation and storage of peptides for proteomics using StageTips. Nat. Protoc. 2007;2:1896–1906. doi: 10.1038/nprot.2007.261. [DOI] [PubMed] [Google Scholar]
- 61.Ting L., Rad R., Gygi S.P., Haas W. MS3 eliminates ratio distortion in isobaric multiplexed quantitative proteomics. Nat. Methods. 2011;8:937–940. doi: 10.1038/nmeth.1714. [DOI] [PMC free article] [PubMed] [Google Scholar]
- 62.McAlister G.C., Nusinow D.P., Jedrychowski M.P., Wühr M., Huttlin E.L., Erickson B.K., Rad R., Haas W., Gygi S.P. MultiNotch MS3 enables accurate, sensitive, and multiplexed detection of differential expression across cancer cell line proteomes. Anal. Chem. 2014;86:7150–7158. doi: 10.1021/ac502040v. [DOI] [PMC free article] [PubMed] [Google Scholar]
- 63.Huang T., Choi M., Tzouros M., Golling S., Pandya N.J., Banfai B., Dunkley T., Vitek O. MSstatsTMT: Statistical Detection of Differentially Abundant Proteins in Experiments with Isobaric Labeling and Multiple Mixtures. Mol. Cell. Proteomics. 2020;19:1706–1723. doi: 10.1074/mcp.RA120.002105. [DOI] [PMC free article] [PubMed] [Google Scholar]
- 64.Kohler D., Staniak M., Tsai T.-H., Huang T., Shulman N., Bernhardt O.M., MacLean B.X., Nesvizhskii A.I., Reiter L., Sabido E., et al. MSstats Version 4.0: Statistical Analyses of Quantitative Mass Spectrometry-Based Proteomic Experiments with Chromatography-Based Quantification at Scale. J. Proteome Res. 2023;22:1466–1482. doi: 10.1021/acs.jproteome.2c00834. [DOI] [PMC free article] [PubMed] [Google Scholar]
- 65.Benjamini Y., Hochberg Y. Controlling the False Discovery Rate: A Practical and Powerful Approach to Multiple Testing. J. R. Stat. Soc. Series B Stat. Methodol. 1995;57:289–300. doi: 10.1111/j.2517-6161.1995.tb02031.x. [DOI] [Google Scholar]
Associated Data
This section collects any data citations, data availability statements, or supplementary materials included in this article.
Supplementary Materials
Table lists the function snippet, corrective coefficient, and cell-type enrichment information on each neuronal maturation marker gene and the maturation loading control gene CNR1. Related to Figure 3G, 3H, and 4F.
When AraC was omitted or Y-27632 was included, cells with progenitor morphology migrate and clump together.
Data Availability Statement
-
•
Raw proteomics data files were deposited into the MassIVE repository with the identifier MassIVE: MSV000093150. The snRNA-seq data and bulk RNA-seq on NGN2 iNs generated in this study have been deposited in the Gene Expression Omnibus (GEO) repository under accession number GEO: GSE244371, DD iN time-course data under GEO: GSE266359, and the rest of data related to Figure S2D under GEO: GSE273553. These datasets will be publicly available as of the date of publication.
-
•
This study generated original code as an image analysis pipeline for measuring neuronal maturity (Data S1).
-
•
Any additional information needed to reanalyze the data reported in this study will be provided by the lead contact upon request.