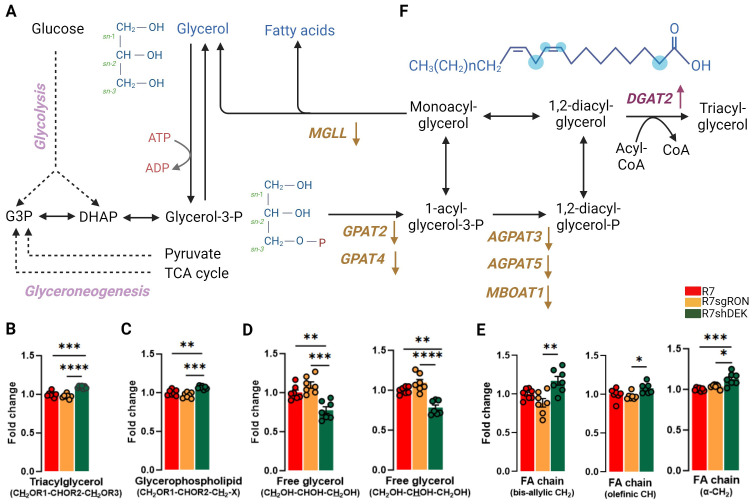
Figure 4.
DEK knockdown increases glycerophospholipids and FA while decreasing free glycerol. (A) Schematic representation of metabolic processes involved in the production of glycerol, glycerophospholipids, and fatty acids. Translation products from the KMplot.com-derived lipid metabolism gene signature have been added where appropriate, with an upward arrow indicating that upregulation of this gene is associated with worse patient outcomes and a downward arrow indicating that downregulation of this gene is associated with better patient outcomes. (B) Intracellular fold change of the protons located at positions C1 and C3 of the glycerol backbone (CH2OR1–CHOR2–CH2OR3) of the TAG. (C) The glyceryl C3H2 group (CH2OR1–CHOR2–CH2-X) of glycerophospholipids. (D) The NMR peaks derived from free glycerol, both C1H3 and C3H3 and C2H2 resonances. (E) Analysis of the bis-allylic (–CH2) groups, which is specific for linoleic acid, the olefinic (–CH), and α-methylene fatty acid group of the acyl chain. (F) Chemical structure of a representative fatty acid. The blue dots represent the carbon position analyzed by 1H-NMR. Bar plots indicate mean ± SEM. Replicates of each cell line are shown as individual dots (n = 7). Statistical significance was assessed using one-way ANOVA. *P ≤ 0.05; **P ≤ 0.01; ***P ≤ 0.001; ****P ≤ 0.0001. MGLL, monoglyceride lipase; DGAT2, diacylglycerol O-acyltransferase 2; GPAT2, 1-acylglycerol-3-phosphate O-acyltransferase 2; GPAT4, glycerol-3-phosphate acyltransferase 4; AGPAT3, 1-acylglycerol-3-phosphate O-acyltransferase 3; AGPAT5, 1-acylglycerol-3-phosphate O-acyltransferase 5; MBOAT1, membrane-bound O-acyltransferase domain containing 1.

