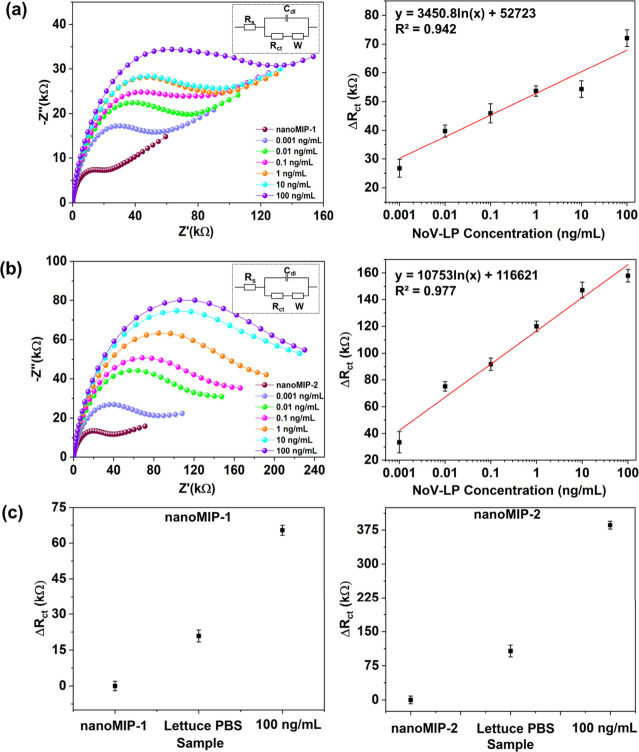
Figure 6.
Nyquist plots and corresponding dose–response plots showing the electrochemical detection of NoV-LP concentrations of 1 pg/mL to 100 ng/mL using (a) GCE/4ABA/EDC+NHS/nanoMIP-1 and (b) GCE/4-ABA/EDC+NHS/nanoMIP-2; insets: equivalent electrochemical circuits. (c) ΔRct values for GCE/4-ABA/EDC+NHS/nanoMIP-1 and GCE/4ABA/EDC+NHS/nanoMIP-2 with NoV-LP concentration of 100 ng/mL in romaine lettuce rinsewater. The error bars represent the standard deviation of the three measurements.

