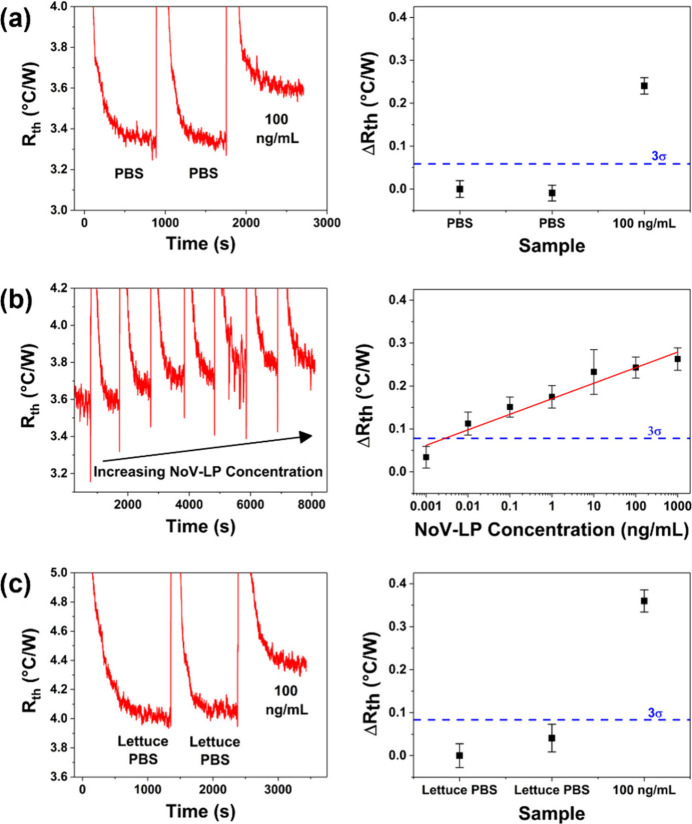
Figure 7.
Typical raw data and corresponding dose–response plots show the thermal detection of various NoV-LP solutions using SPEs modified with nanoMIP-1. The 3σ line in the dose response plots represents the baseline σ of the control sample multiplied by three. (a) NoV-LP concentration of 100 ng/mL in PBS. (b) NoV-LP concentrations of 1 pg/mL to 1 μg/mL in PBS. (c) NoV-LP concentration of 100 ng/mL in romaine lettuce rinsewater.

