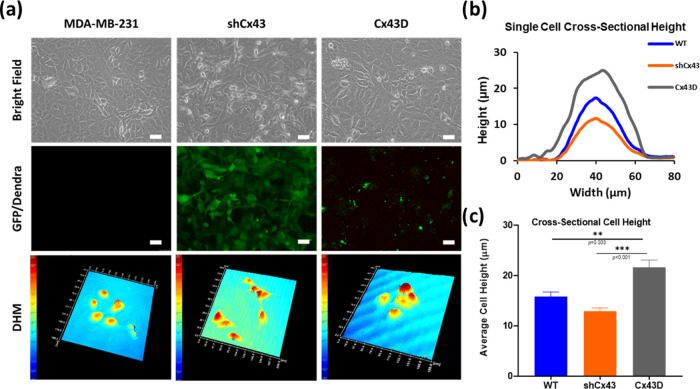
Figure 1.
Cx43 gene regulation in MDA-MB-231 cells affects cell size and morphology. (a) Representative images of parental MDA-MB-231 (WT), shCx43, and Cx43D cells. Cell morphology and size are shown in the bright microscopy panel. The quality of transfected and transduced MDA-MB-231 cells with shCx43/Cx43D vectors, respectively, is represented in the GFP/Dendra panel. Scale bar: 50 μm. The bottom panel represents three-dimensional (3D) reconstructed holographic images of the different cell subtypes. (b) Cross-sectional height cell measurements of MDA-MB-231 WT, shCx43, and Cx43D cells, as depicted by the DHM. (c) Average cross-sectional cell height from at least 30 single cells in each Cx43 expression condition. The values depicted are the mean ± standard error of the mean (SEM) from three separate experiments, and at least 30 cells were evaluated per condition. *** denotes a p-value <0.001, ** denotes a p-value <0.01, and * denotes a p-value <0.05 compared to different conditions using analysis of variance (ANOVA) followed by the post hoc Tukey honestly significant difference (HSD) test.

