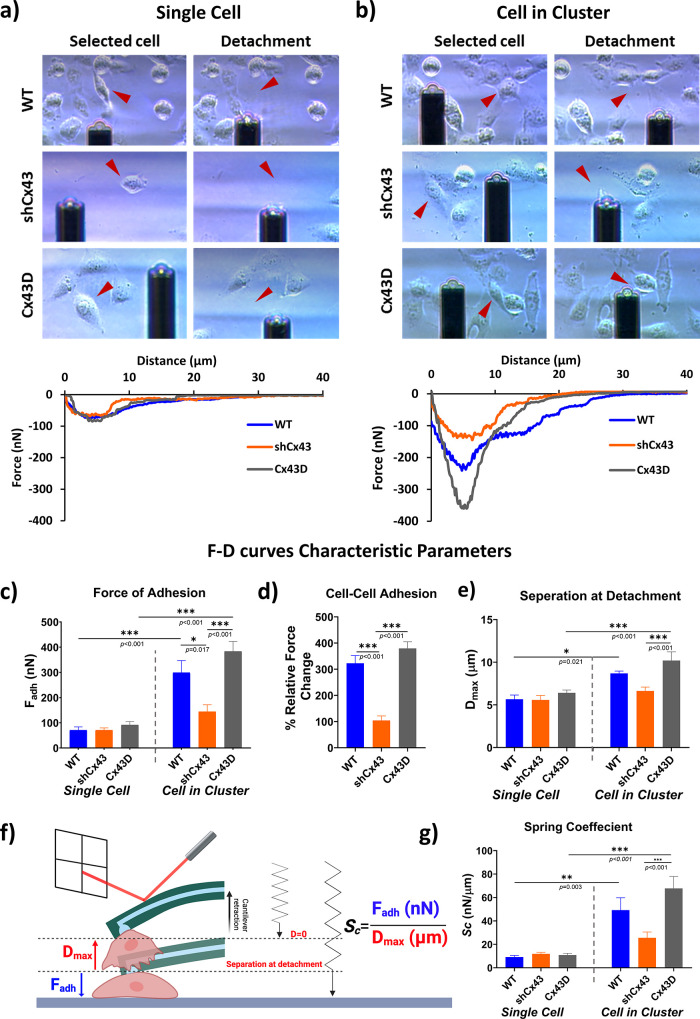
Figure 2.
Metastatic state of MDA-MB-231 cells dictates cellular adhesion strength revealed by fluidic-based SCFS. (a) Individual cell, and (b) cell in a cluster (cell adherent to at least two cells) detachment of MDA-MB-231 WT, shCx43, and Cx43D cells. Adhesion forces of single cells reflect cell–substrate adhesion, while those of a cell in a cluster reflect cell–cell adhesion. (c–g) Comparison of F–D curves characteristic parameters (Fadh, Dmax, and Fadh/Dmax ratio, referred to as spring coefficient (Sc)) between MDA-MB-231 cells with varying expression of Cx43 and different cell culture categories (single cells vs cells in a cluster). (c) Average adhesion force measured in MDA-MB-231 cells with varying Cx43 expression in single and cluster cell states. (d) Intercellular adhesion forces of MDA-MB-231 cells with varying Cx43 expression are represented by the relative force change between cells in cluster and single-cell states. (e) Average longest cantilever elongation before detachment (represented by Dmax) in single and cluster cell states. (f) Spring coefficient (Sc) concept and an illustrative schematic (not to scale) showing the elastic deformation capability of the cell upon pulling it from the surface using a hollow FluidFM cantilever. The ratio of Fadh (maximum force) over Dmax (longest elongation before detachment) when pulling the cell characterizes cell elasticity potential and can be interpreted from the F–D curves. Adapted with permission from ref (24) reference # 1488717-1. Copyright 2024 RSC. (g) Average cell elasticity represented by Fadh/Dmax between MDA-MB-231 cells in different culture states. The concept of cell elasticity was adapted from ref (25). The values depicted are the mean ± SEM from three separate experiments, and at least 15 cells were evaluated per condition. *** denotes a p-value <0.001, ** denotes a p-value <0.01, and * denotes a p-value <0.05 compared to different conditions using ANOVA followed by the post hoc Tukey HSD test.

