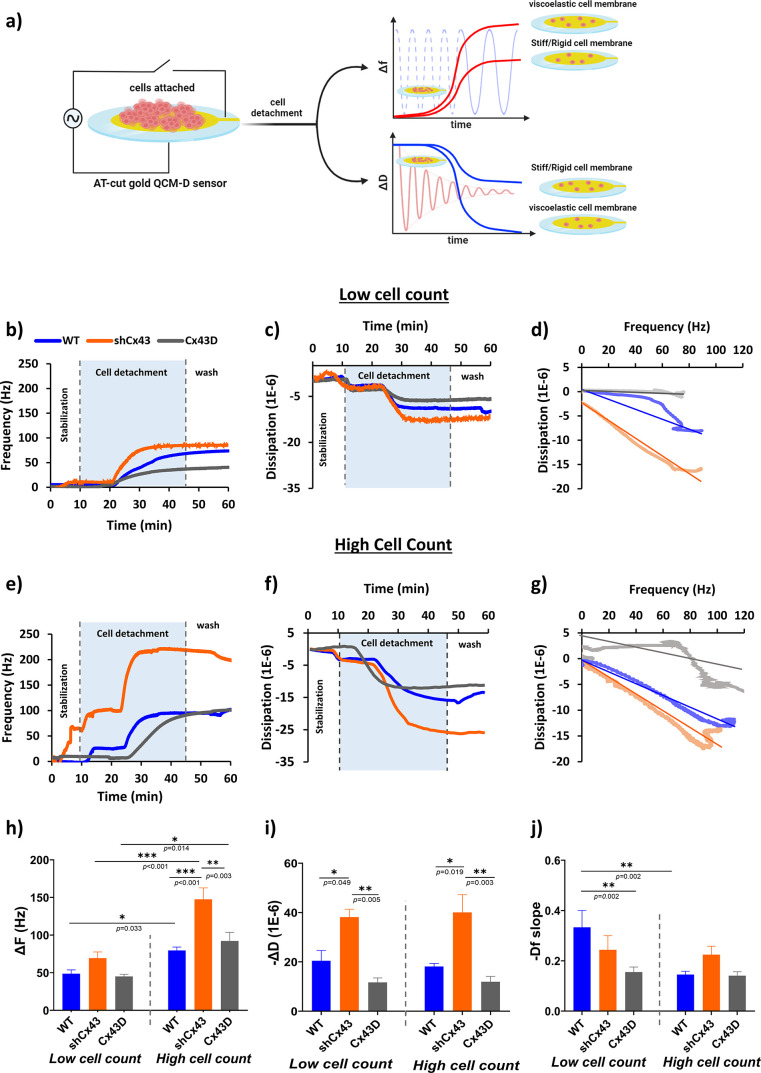
Figure 3.
Metastatic state of MDA-MB-231 cells influences cellular viscoelasticity revealed by QCM-D. (a) Illustration of QCM-D cell-based experiments in liquid conditions and the corresponding plots reporting changes in frequency (ΔF) and dissipation energy (ΔD) vs time according to the rigidity or softness of the cell layer. QCM-D utilizes a converse piezoelectric effect: the AT-cut quartz crystal oscillates when an electric voltage is applied. The mechanical oscillations can be transferred into an equivalent electric circuit model, which allows the depiction of a complete description of the oscillation in the presence of a mass and viscous loading. In the case of soft and viscoelastic cell monolayers, the amplitude of the crystal oscillation decreases rapidly due to the high energy losses compared to rigid cell monolayers. (b–j) Real-time QCM-D measurements. (b) ΔF- and (c) ΔD-responses, and the corresponding (d) Df -plots with linear regression of low cell count MDA-MB-231 cells with varying expression of Cx43 undergoing cell detachment. (e) ΔF- and (f) ΔD-responses and the corresponding (g) Df-plots with linear regression of high cell count MDA-MB-231 cells with varying expression of Cx43 undergoing cell detachment. The cells were seeded on top of AT-cut gold-coated quartz sensors for 24 h, after which they were mounted on the modules and washed with PBS for 10 min at a 10 μL/min flow rate. The cells were detached with trypsin at 30 μL/min, and the frequency and dissipation were recorded over a period of 35 min. The cells were then washed with PBS to remove the unbound cells. Change in (h) frequency and (i) dissipation amplitudes and (j) Df-slopes for MDA-MB-231 cells with varying Cx43 expression at different cell count states. The values depicted are the mean ± SEM from at least three separate experiments evaluated per condition. *** denotes a p-value <0.001, ** denotes a p-value <0.01, and * denotes a p-value <0.05 compared to different conditions using ANOVA followed by the post hoc Tukey HSD test. The data shown are from the same control and experimental pair.

