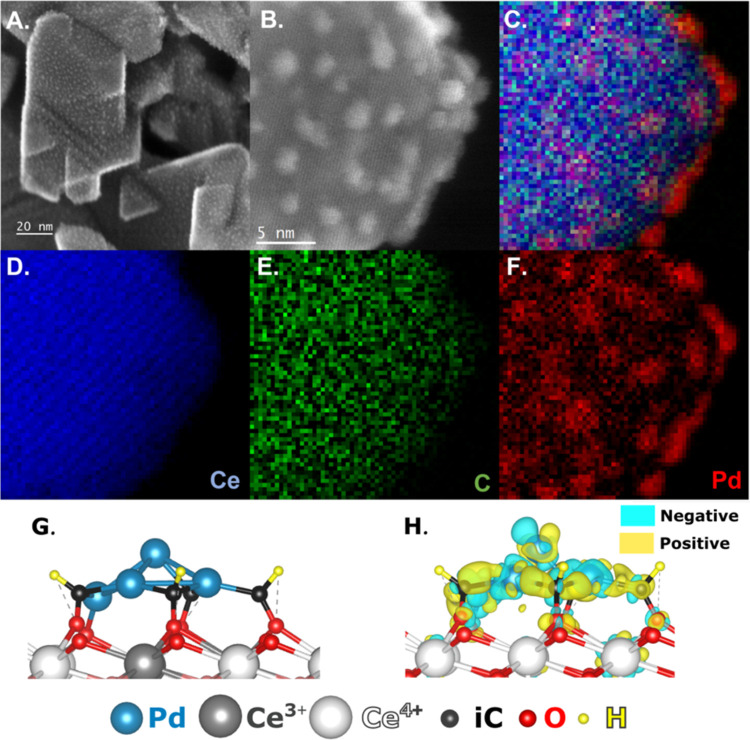
Figure 5.
Secondary electron (SE) STEM imaging of Pd-iC-CeO2 for (A) after 3 consecutive reaction cycles (B) STEM-EELS inset (C) STEM-EELS combined elemental mapping, (D–F) Ce, C, and Pd elemental mapping, respectively. Reaction conditions: 25 mg of catalyst, 75 °C for 1 h, 15 mL of 0.5 M H2O2 (aq), 20 bar initial pressure of 20%CH4 in Ar balance, 800 rpm mixing. Theoretical model of Pd-iC-CeO2 showing the (G) side view and (H) charge density difference plot, positive/negative differences are visually represented with yellow/cyan, respectively. Color coding: Pd atoms are light blue, Ce4+ white, Ce3+ gray, O atoms of the first layer red, while those of the second layer are light red, iC atoms black and H atoms yellow.

