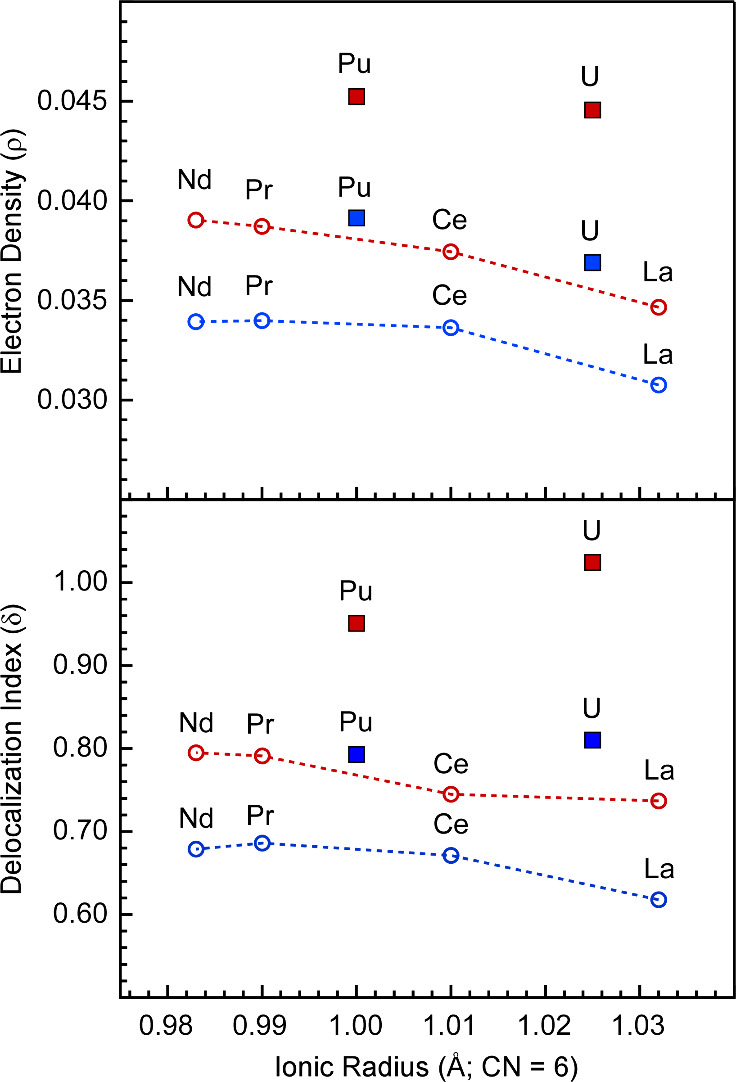
Figure 4.

Top – Average QTAIM electron density (ρ) at the M–H bond critical points (PBE/TZP) for the chelating (blue) and bridging (red) ligands in the trivalent lanthanide and actinide dimers plotted as a function of ionic radius.26Bottom – Sum per ligand of the M–H delocalization indices (PBE/TZP) for the chelating (blue) and bridging (red) ligands in the trivalent lanthanide and actinide dimers. Actinides are represented by solid squares, whereas lanthanides are represented by open circles. Data points in red represent average values obtained for bridging ligands, whereas data points shown in blue represent average chelating ligands. Dashed lines between the lanthanide data points are to help guide the eye.
