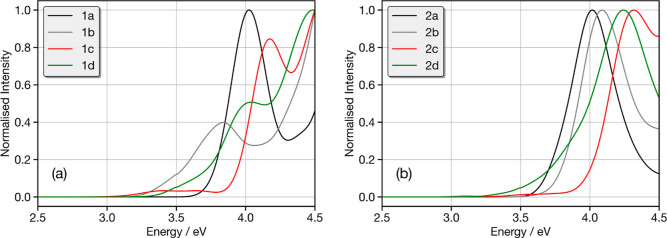
Figure 5.
Calculated absorption spectrum of (a) 1a (black), 1b (gray), 1c (red), and 1d (green) and (b) 2a (black), 2b (gray), 2c (red), and 2d (green). Each spectrum is calculated by averaging the 100 spectra simulated from structures sampled at random from the ground state AIMD. Each individual spectrum has been broadened using the Gaussian with a full-width at half-maximum of 0.1 eV.

