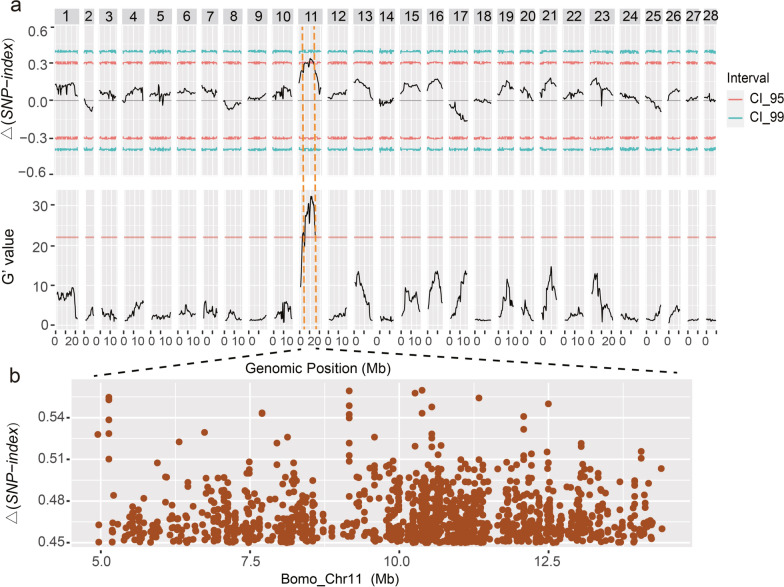
Fig. 2.
QTL mapping analysis of the CSR/RPC. a The Δ(SNP-index) and G' values of the SNPs in the merged CSR_L and CSR_H pools were calculated in the whole genome via a sliding window method with a window size of 1e6 bp. The numbers along the top of the figure represent silkworm chromosome numbers. X-axis: physical distance of each chromosome (Mb); the lines for CI_95 and CI_99 in Δ(SNP-index) means the two-sided confidence intervals of 0.95 and 0.99, respectively; the line in the G' value plot means FDR = 0.01. b Δ(SNP-index) statistics for each SNPs within the QTL region, and points indicate SNPs with a Δ(SNP-index) ≥ 0.45. X-axis: Physical position within the mapping region of silkworm Chr11

