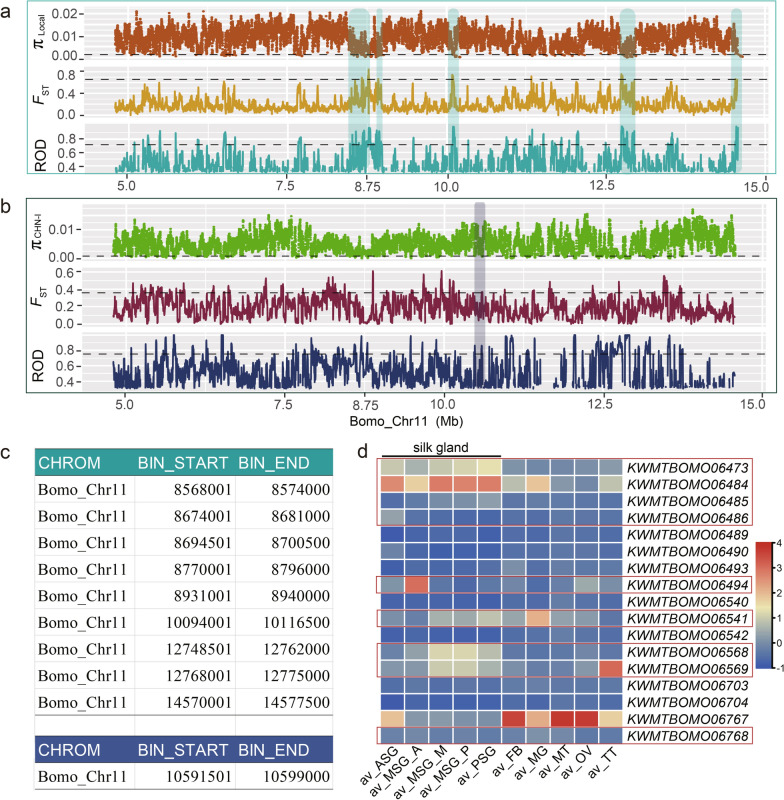
Fig. 3.
Selection signals within the mapped regions during domestication and genetic breeding processes. a, b Analysis of the selection pressure of the QTL region during domestication (a) and breeding (b) of silkworms via a sliding window method with a window size of 5 kb and a step-size of 500 bp. Threshold line in (a): πLocal ≤ lowest 5% (0.0014), FST Wild-Local ≥ top 1% (0.63) and ROD Wild-Local ≥ top 5% (0.7). Threshold line in (b): πCHN-I ≤ lowest 5% (0.0008), FST Local-CHN-I ≥ top5% (0.35) and ROD Local-CHN-I ≥ top 5% (0.75). Green shadow box: region selected by domestication. Blue shadow box: region subjected to selection during CHN-I improvement. The SNPs are extracted from the re-sequenced data of silkworm strains in Additional file 2 Table S1, and sample sizes n of Wild, Local and CHN-I silkworms are 51, 205 and 105, respectively. c Genomic start and end positions of the window bins (bp) in the artificially-selected region. Up: domestication-selected regions. Down: improvement-selected region. d Heat-map of the tissue expression of genes in regions under artificial selection. Red boxes indicate the genes with a higher expression level in the silk gland (SG). ASG: anterior silk gland; MSG_A: anterior segment of middle silk gland; MSG_M: middle segment of middle silk gland; MSG_P: posterior segment of middle silk gland; PSG: posterior silk gland; FB: fat body; MG: midgut; MT: Markov tube; OV: ovary; TT: testis; av: mean FPKM values of three biological replicates. The data consisted of the FPKM values derived from the transcriptome of tissues dissected from the 3rd day of the 5th instar larvae of silkworm strain P50, as provided in KAIKObase version 4.0.0

