
FIGURE 3:
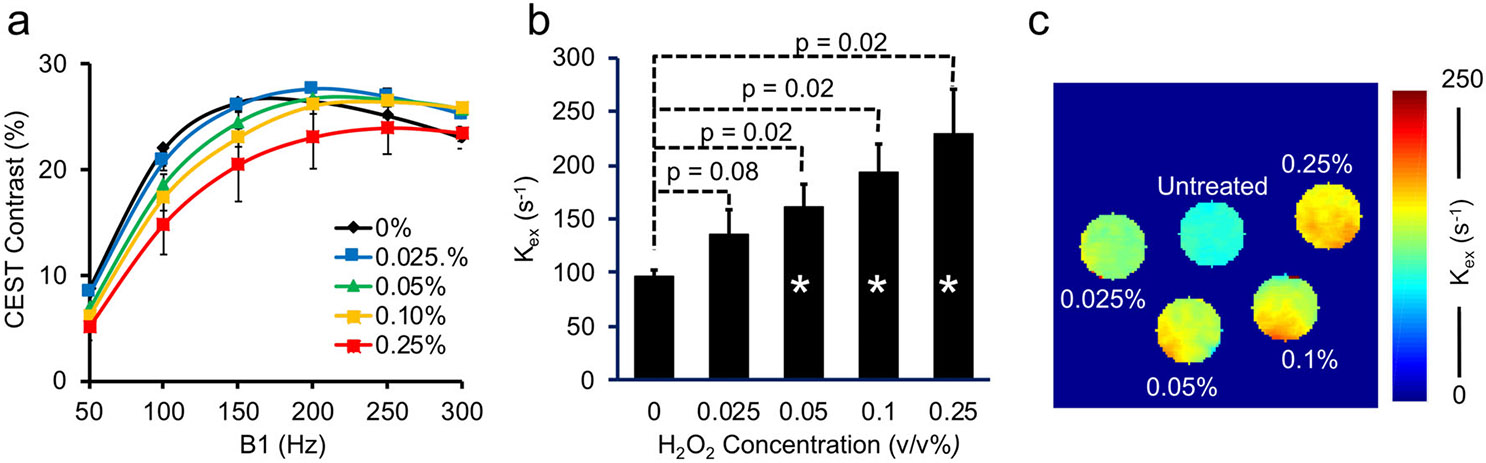
(a) QUESP data, or the CEST contrast as a function of RF saturation power B1 (1 μT = 42.6 Hz), under different H2O2 concentrations (treated for 1 hour) were fitted to determine the proton exchange rate . (b) derived from QUESP data fitting increases with H2O2 treatment concentration. (c) Representative maps from egg white samples untreated or treated with different H2O2 concentrations. *P < 0.05.