
Fig. 2: Genes with archaic-specific SAVs are enriched for roles in many phenotypes.
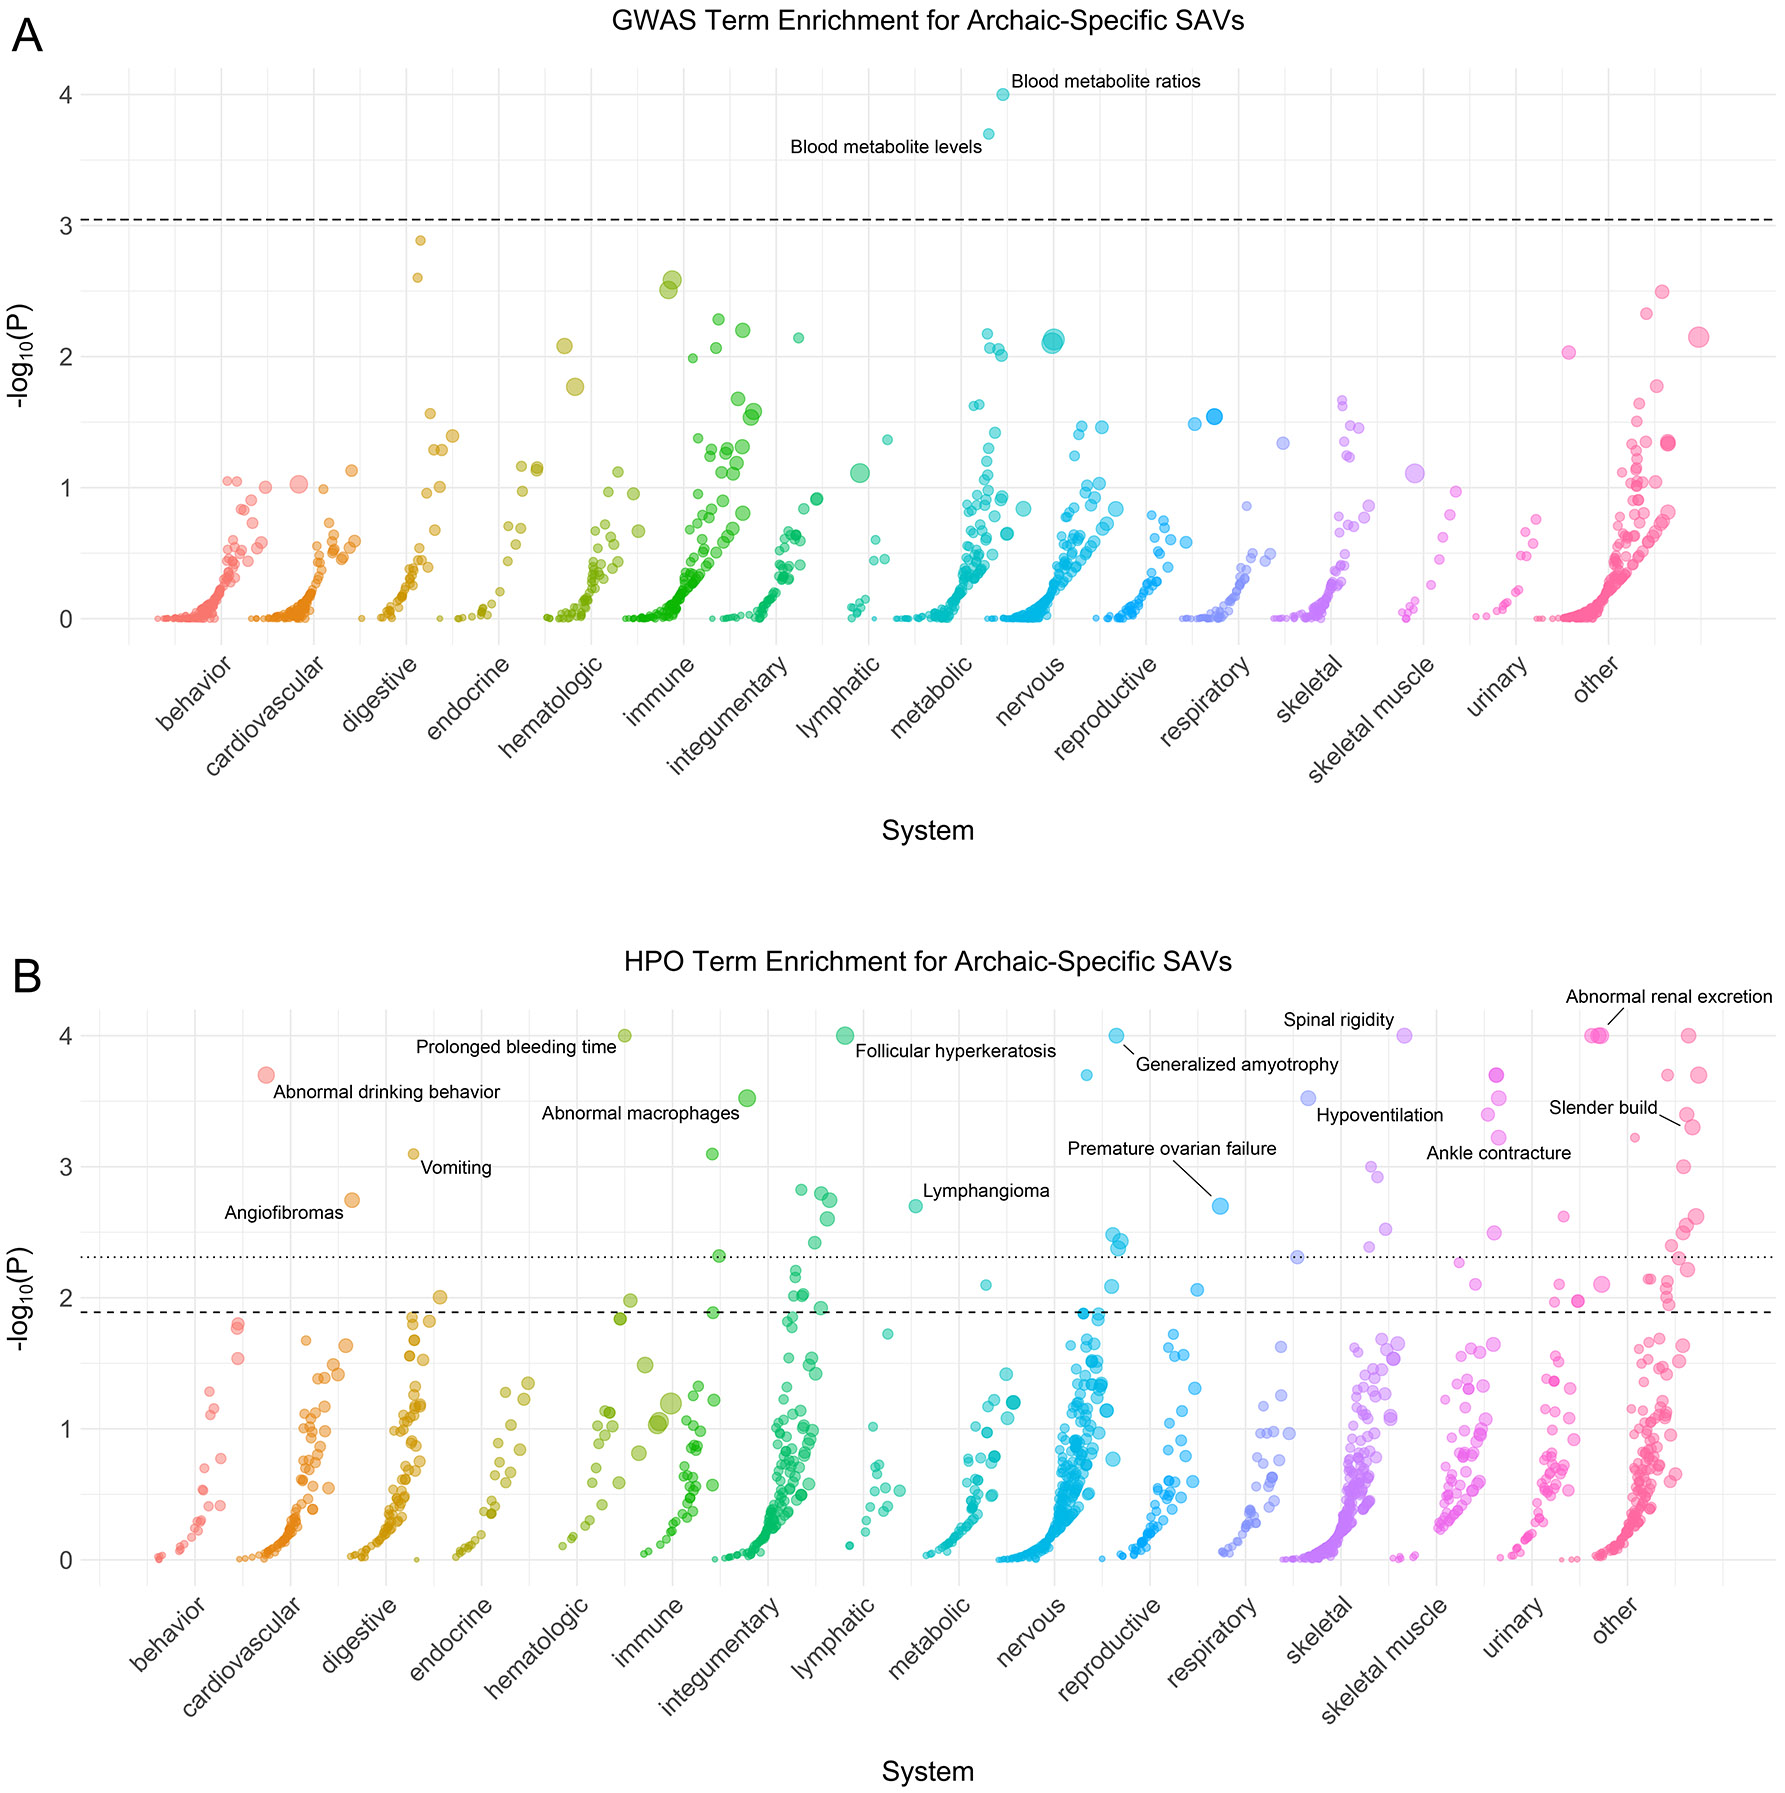
(A) Phenotype associations enriched among genes with archaic-specific SAVs based on annotations from the 2019 GWAS Catalog. Phenotypes are ordered by increasing enrichment within manually curated systems. Circle size indicates enrichment magnitude. Enrichment and p-values were calculated from a one-sided permutation test based on an empirical null distribution generated from 10,000 shuffles of maximum Δ across the entire dataset (Methods). Dotted and dashed lines represent false discovery rate (FDR) corrected p-value thresholds at FDR = 0.05 and 0.1, respectively. One example phenotype with a p-value ≤ the stricter FDR threshold (0.05) is annotated per system. (B) Phenotypes enriched among genes with archaic-specific SAVs based on annotations from the Human Phenotype Ontology (HPO). Data were generated and visualized as in A. See Supplementary Data 2 for all phenotype enrichment results.