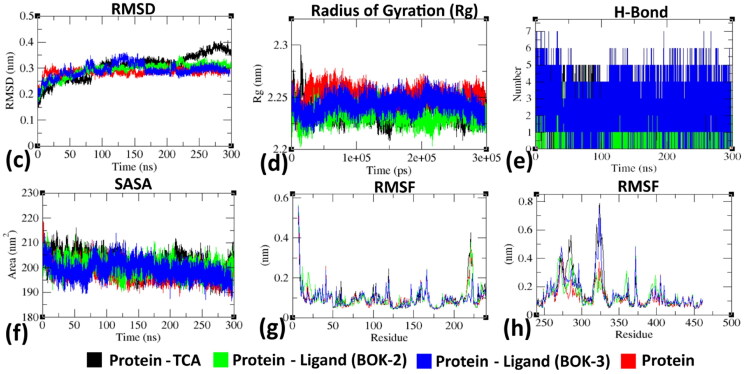
Figure 7.
Evaluation of RMSD, Rg, hydrogen bond formation, SASA, and RMSF of DprE1 (protein) with BOK-2, BOK-3, and TCA-1 (ligand) complexes at 300,000 ps (300 ns). (c) Temporal changes in backbone RMSD of DprE1 protein with and without ligand complexes. (d) Variation of protein backbone Rg between its unbound and complexed states throughout the simulation duration. The y-axis represents Rg (nm), while the x-axis depicts the time interval (ps). (e) Temporal evolution of hydrogen bonds between protein and ligand throughout simulation (ns) (f) Time-dependent SASA analysis. The y-axis represents SASA (nm), while the x-axis denotes time (ns). (g) and (h) Comparison of residue-wise average RMSF plot between protein in native and ligand-bound states.

