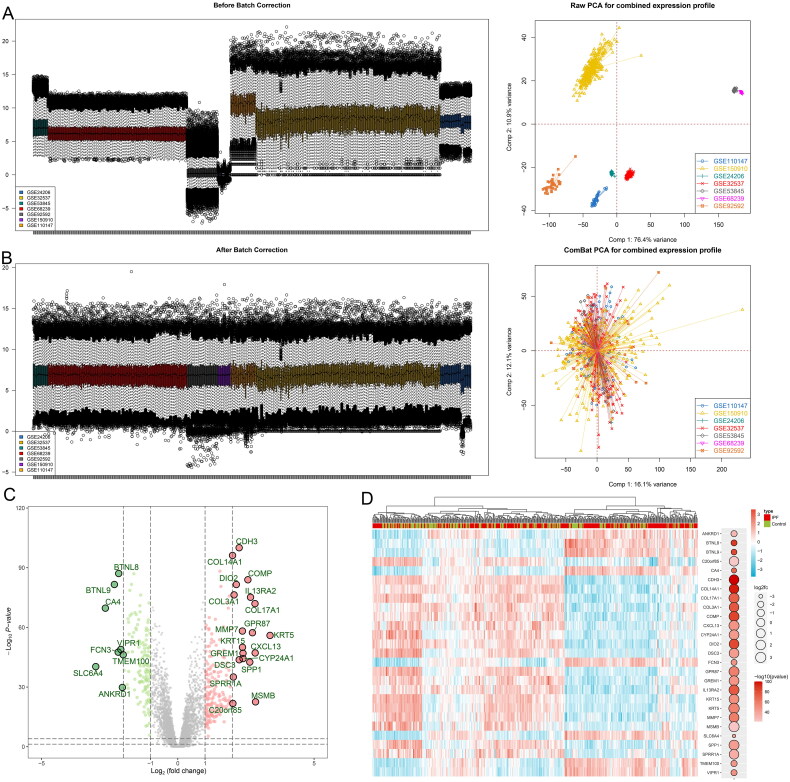
Figure 1.
Data preprocessing and identification of differentially expressed genes. The box plot and principal component analysis elucidate the overall gene expression profiles (A) before and (B) after the normalization process. These results substantiate the effective removal of batch effects. Volcano plot (C) and heatmap (D) display the differentially expressed genes, highlighting significant variations in gene expression.

