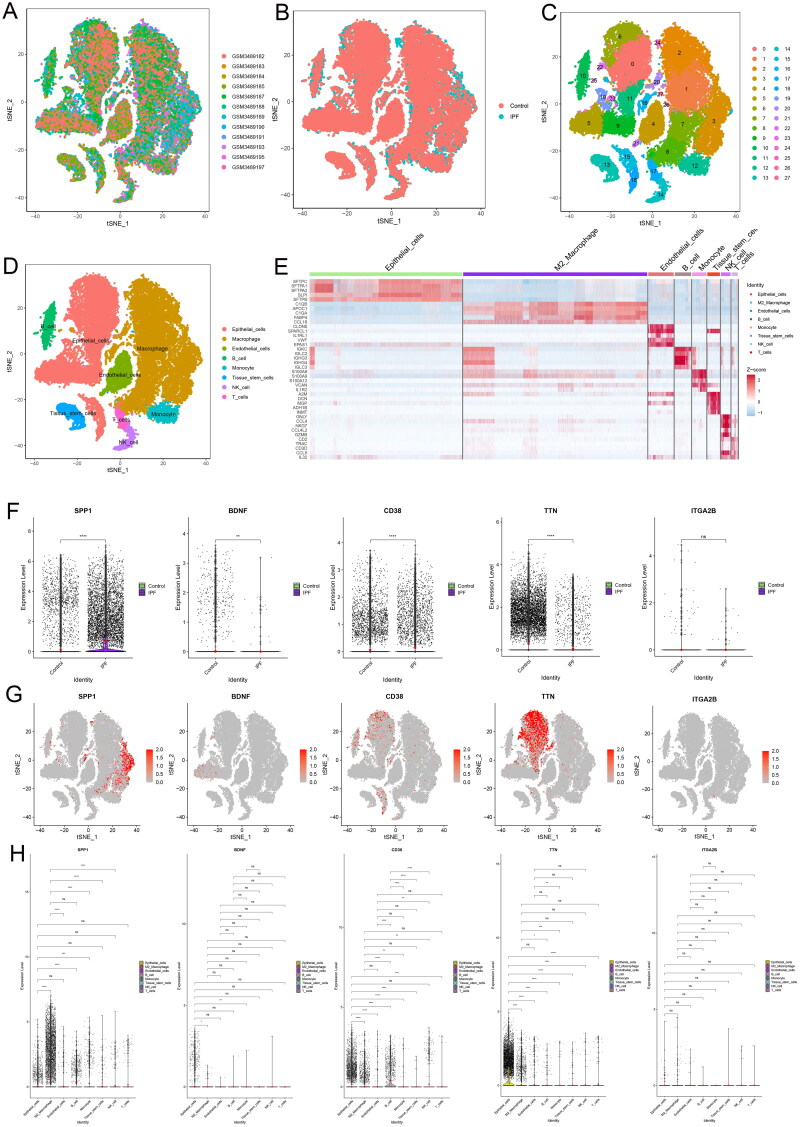
Figure 6.
Single-cell sequencing results. (A) t-distributed Stochastic Neighbor Embedding (t-SNE) visualization of the 12 samples. (B) t-SNE plots comparing normal and IPF samples. (C) t-SNE representation of the 28 cell clusters. (D) Cell types were delineated based on marker gene profiles. (E) Heat map displaying the top 5 marker genes across 8 cell types. (F) Comparative analysis of 5 hub genes between IPF and control groups. (G) Feature plots illustrating the expression of the 5 hub genes across 8 cell types. (H) Differential comparison of the 5 hub genes among the 8 cell types, highlighting the variance in gene expression patterns.

