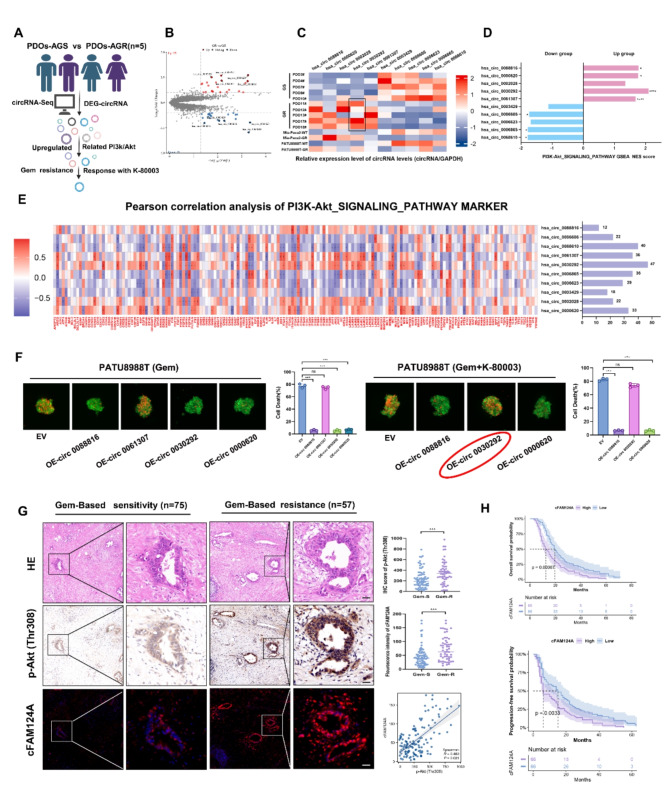
Fig. 4.
cFAM124A is a potential biomarker for the ability of K-80003 to increase AG sensitivity of PDAC. A, Flowchart for screening for K-80003 response markers. B, Volcano plot showing upregulated and downregulated circRNAs between PDO-AGS and PDO-AGR groups. C, RT-qPCR detection of the expression of 10 relevant circRNAs in PDAC PDOs and cells. D, GSEA of 10 circRNAs demonstrating enrichment of DEGs in the PI3K/Akt pathway. E, Pearson correlation analysis between PI3K/Akt signaling pathway marker expression and the 10 circRNAs and number of related genes. F, Necrosis in 3D tumor microspheres based on propidium iodide (PI) staining (red) and its quantification after treatment with Gem (1 µM) and/or K-80003 (5 nM). Scale bar, 100 μm. G, Representative H&E and IHC staining for p-Akt (Thr308) and FISH staining for cFAM124A in samples from GEM-sensitive (Gem-S) and GEM-resistant (Gem-R) patients. Quantification of p-Akt (Thr308) staining in PDAC tissues collected from Gem-S and Gem-R groups. Quantification of cFAM124A staining in PDAC tissues collected from Gem-S and Gem-R groups. Pearson correlation analysis between p-Akt (Thr308) expression and cFAM124A expression. H, Kaplan–Meier OS and PFS curves according to cFAM124A expression for PDAC patients in Table S3 (n = 132). Not significant (ns), *P < 0.05; **P < 0.01; ***P < 0.001

