Fig. 2.
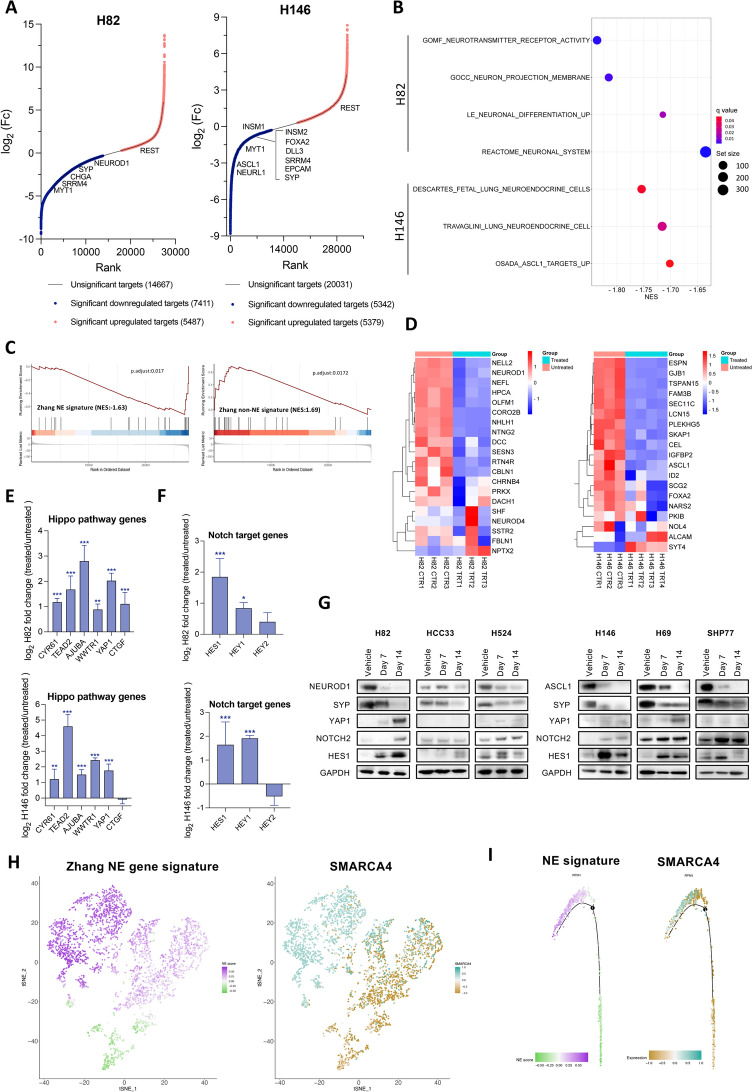
SMARCA4 inhibition suppresses the NE phenotype in SCLC. A Hockey-stick plots of DEGs in FHD-286-treated cells after 14 days (100 nM) versus control, untreated cells. (See Table S1). B Dot plots showing negative enrichment in selected neuronal and NE pathways analyzed by GSEA in RNAseq data from H82 and H146 cell lines treated with FHD-286 versus untreated. (See Table S1). C GSEA applying Zhang et al. NE gene signature [28] in H82 cell line treated with FHD-286 versus untreated. D Heatmaps showing the most significant confident targets (top 25 with TPMs > 2) of NEUROD1 (left) and ASCL1 (right) [7], in H82 (left) and H146 (right) bulk RNAseq (FHD-286 treated vs untreated). E Log2 fold change of Hippo pathway genes from data in A. Student’s two-tailed unpaired t test. ***p < 0.001, **p < 0.01. The mean ± SD is shown. F Log2 fold change of NOTCH pathway genes from data in A. Student’s two-tailed unpaired t test. ***p < 0.001, *p < 0.05. The mean ± SD is shown. G Western blotting of H524 (SCLC-N), H82 (SCLC-N), HCC33 (SCLC-N), H69 (SCLC-A), SHP77 (SCLC-A) and H146 (SCLC-A) cells after treatment with 100 nM of FHD-286 for 7 and 14 days. H t-SNE of Zhang NE signature and SMARCA4 levels applied to public scRNAseq data of 4 myc-driven murine (RPM) tumors [6]. I Scoring for Zhang NE signature and SMARCA4 projected in a pseudotime trajectory from early to late time points in a tumor from a Myc-driven murine SCLC model showing subtype plasticity [6]. See also Figs. S2, S3 and Table S1

