Fig. 2.
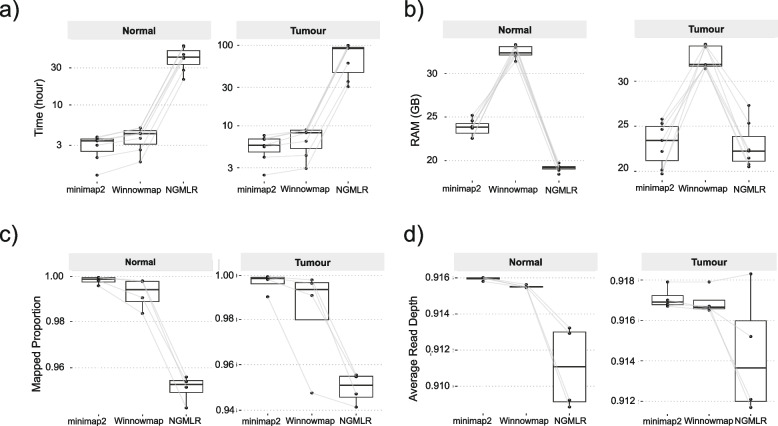
Assessment of three sequence aligners for LRS. a Processing time in hours (y-axis) for three aligners (x-axis). Each box represents seven normal samples (shown on left) and seven tumour samples (shown on right). All data points are shown. The lines between boxes indicate the same samples. b RAM usage in Gb (y-axis) for three aligners (x-axis). Each box represents seven normal samples (shown on left) and seven tumour samples (shown on right). All data points are shown. c Mapping rate (y-axis) for three aligners (x-axis). Four tumour samples (shown on the right) and their paired normal samples (shown on the left) which passed sample quality control are included in the plot. d Genome Coverage (y-axis) for three aligners (x-axis). Four tumour samples (shown on the right) and their paired normal samples (shown on the left) which passed sample quality control are included in the plot

