
Figure 4:
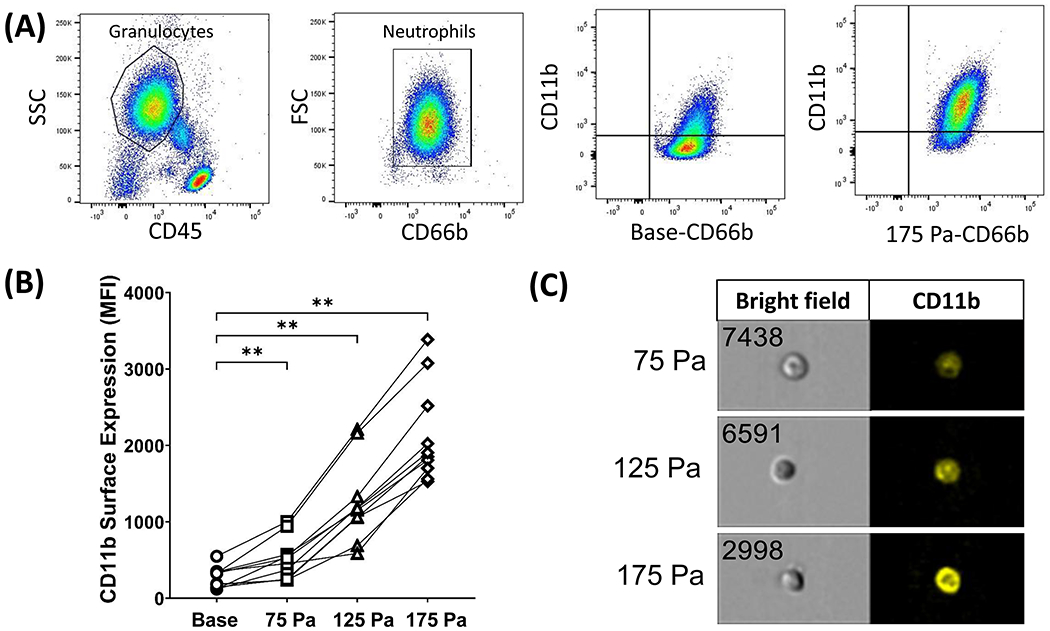
(A) Flow cytometry gating strategy for CD11b expression on CD66b+ neutrophils and representative plots from one experiment for base and 175 Pa samples. (B) Surface expression of CD11b on CD66b+ neutrophils before and after shear stress exposure of 75, 125, and 175 Pa for 1 sec. ** P< 0.05. (C) Representative FlowSight intensity images showing bright field and fluorescent CD11b+ cell images (20X) from Amnis image flow cytometry.