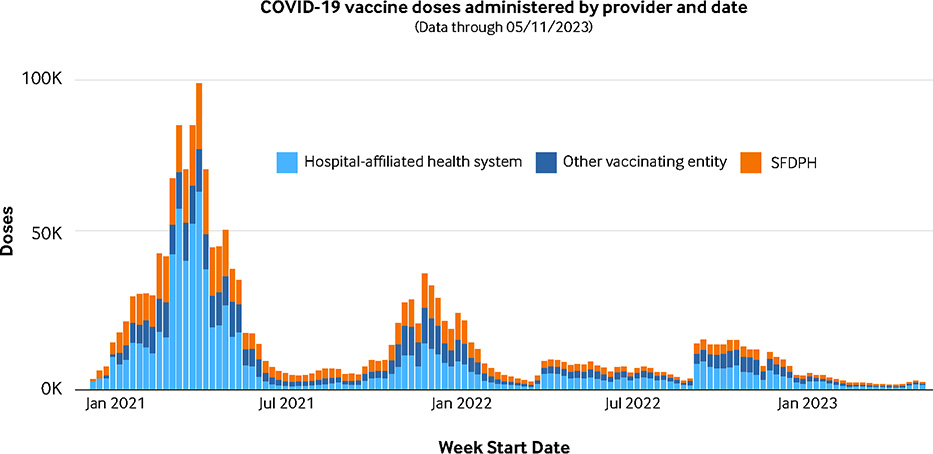
FIGURE 3. San Francisco County Covid-19 Vaccine Administration by Vaccinating Entities over Time.
Administration of Covid-19 vaccinations was shared among San Francisco Health Systems Collaborative participants, as shown in this graph of weekly doses by date and provider type. The bulk of doses (48%) was provided by hospitals and health systems, followed by the San Francisco Department of Public Health (SFDPH; 28%), and other entities (24%), which includes organizations such as Chinese Hospital, a Veterans Administration Health Care System, and Federally Qualified Health Centers.
Source: The authors
NEJM Catalyst (catalyst.nejm.org) © Massachusetts Medical Society

