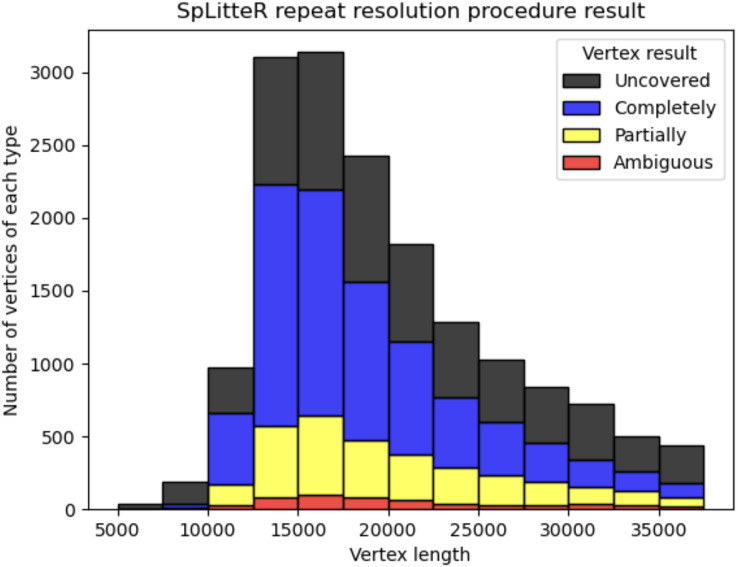
Figure 3. Information about repeat resolution for the HUMAN dataset.
The x-axis shows the length of the vertex (approximate length of a repeat) in the LJA assembly graph. Barplots show the number of completely resolved (blue), partially resolved (yellow), uncovered (black), and ambiguous (red) vertices identified by the SpLitteR repeat resolution procedure. The bin width in the histogram is 2,500 bp.

