
Figure 3 -.
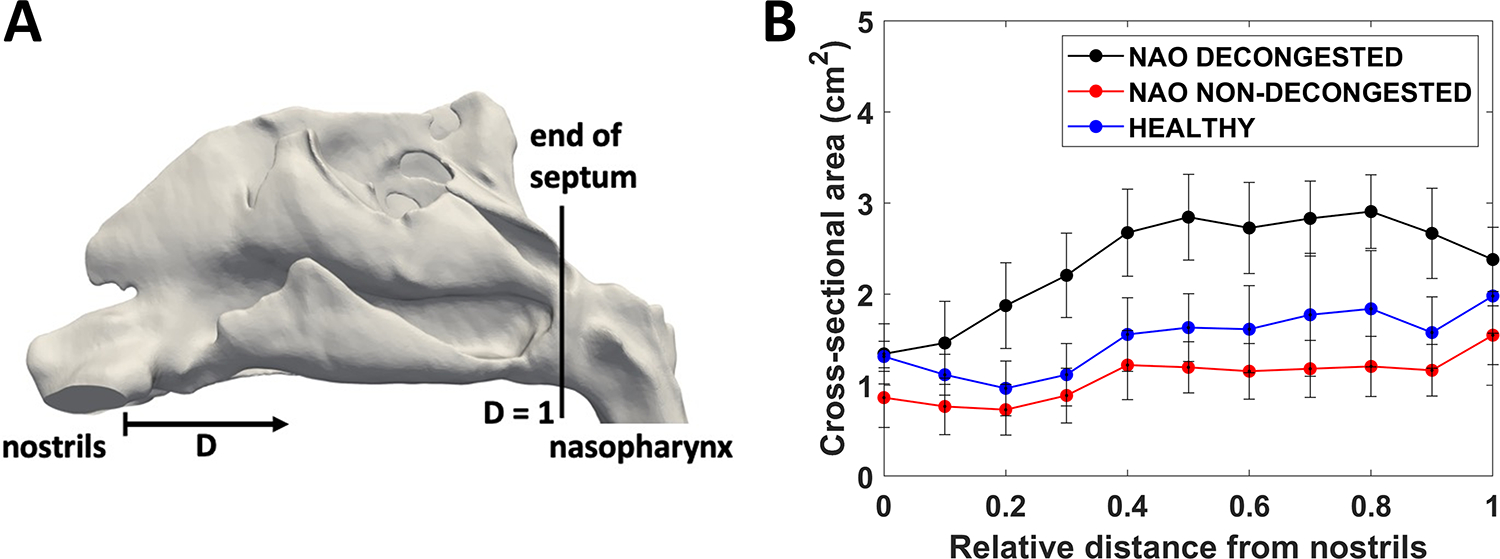
(A) Lateral view of nasal cavity model illustrating the definition of the relative distance (D) from nostrils (D=0) to the posterior end of the septum (D=1). (B) Coronal cross-sectional areas in the cohorts of nasal airway obstruction (NAO) patients with decongestion, NAO patients without decongestion, and healthy subjects without decongestion (narrow side). Error bars: 1 standard deviation.