. 2024 Sep 30;9(11):1925–1937. doi: 10.1039/d4nh00315b

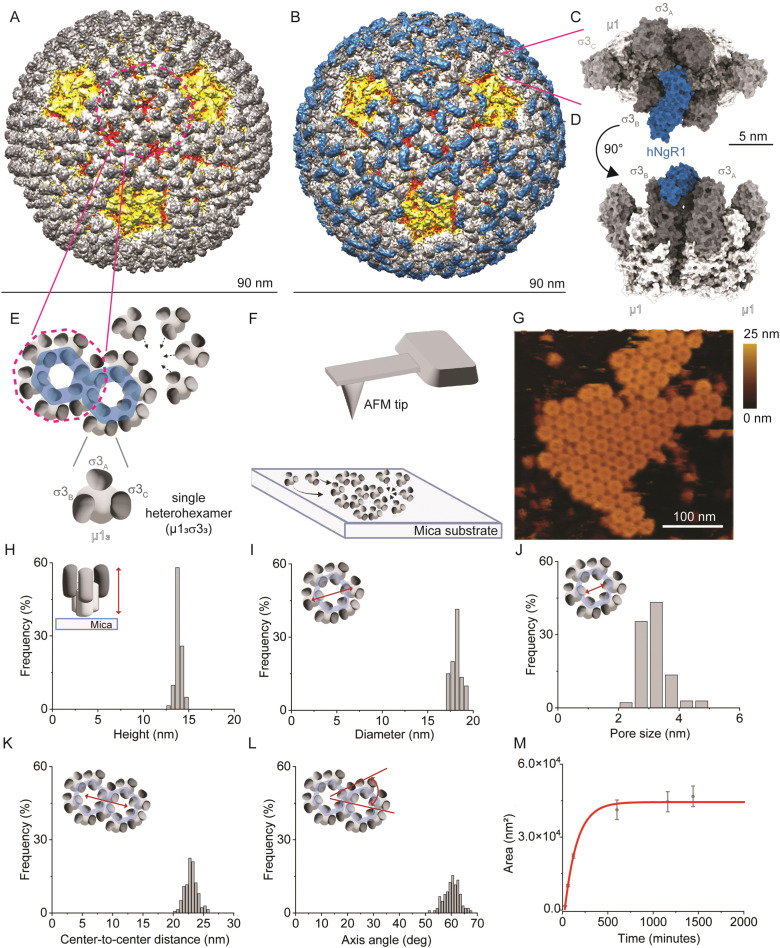
Fig. 1. Imaging the self-assembly of reovirus μ1σ3 heterohexamers. (A) and (B) Density maps of reovirus alone (A) or in complex with hNgR1 (B). Viral capsid proteins λ2, λ1/σ2, μ1, and σ3 are depicted in yellow, red, white, and shades of grey, respectively. The receptor hNgR1 is depicted in blue. (C) and (D) Surface representation of two σ3μ1 heterohexamers in complex with hNgR1 receptor, from the top view (C) and side view (D). (E) Schematics of the assembly of μ1σ3 heterohexamers to form on hexagonal structures, as present on the viral capsid. (F) Schematics of the imaging setup, with a bare AFM tip and self-assembled μ1σ3 heterohexamers on a mica substrate. (G) AFM topography image of a patch of self-assembled heterohexamers. (H)–(L) Histograms of the measured parameters from self-assembled heterohexamers structures: height of single heterohexamers (H), diameter of the hexagonal structure formed (I) and its pore size (J), center-to-center distance between hexagonal structures (K), and their axis angle (L). (M) Area of the imaged self-assembled patches is plotted in function of time and fitted with an exponential fit (red line).

Fig. 1