. 2024 Sep 30;9(11):1925–1937. doi: 10.1039/d4nh00315b

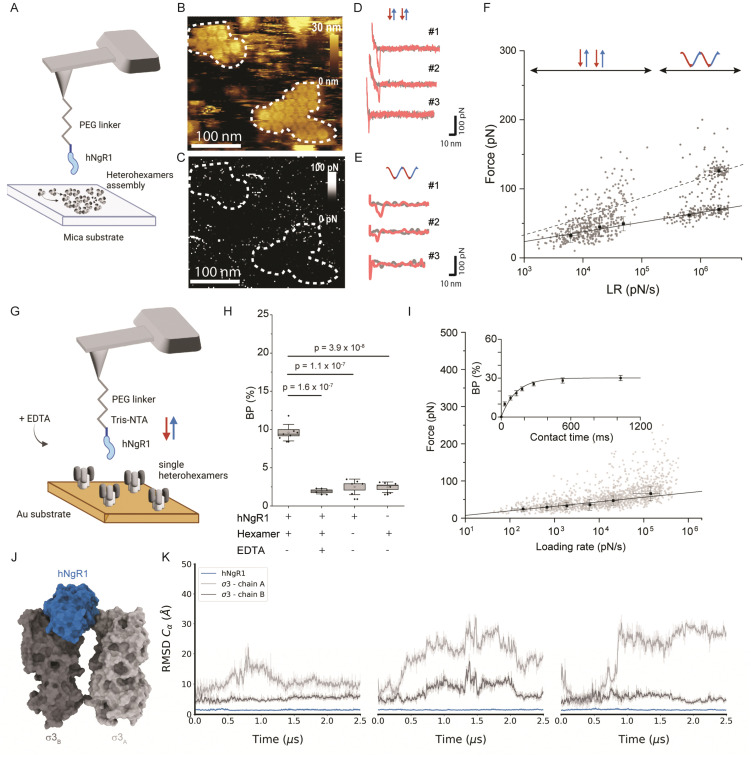
Fig. 2. Probing the hNgR1 interaction with μ1σ3 heterohexamers and predicting the hNgR1–σ3 binding interface. (A) Representation of the experimental setup, with an hNgR1-functionalized AFM tip and self-assembled σ3μ1 heterohexamer patches on a mica substrate. FD and force–time curves are collected, from which forces and LRs are extracted. (B) AFM topography image of the scanned σ3μ1 heterohexamers and (C) the corresponding adhesion map of the same area. Colored scales indicate height and force, respectively. (D) Examples of FD curves recorded in FFV mode (using a linear movement of the tip) that display either specific (#1 and #2) or nonspecific (#3) adhesion events. (E) Examples of FD curves recorded in PFT mode (using a sinusoidal movement of the tip) that display either specific (#1 and #2) or nonspecific (#3) adhesion events. (F) Distribution of rupture forces as a function of their LR measured between hNgR1 and self-assembled σ33μ13 heterohexamers, from AFM experiments conducted with rectangular (data points on the left; lower LRs) or sinusoidal (data points on the right; higher LRs) tip movement. The solid line represents the Bell–Evans fit (for simple ligand–receptor bond) and the dashed line represents the Williams–Evans model prediction (for multiple simultaneous uncorrelated bonds). Error bars indicate SD. (G) Representation of the experimental AFM setup, operated in FV mode with an hNgR1-functionalized tip and single σ33μ13 heterohexamers grafted onto a gold-coated surface. (H) Box plot of the BP calculated for the hNgR1-single heterohexamers interaction and control experiments, including this same interaction with the addition of EDTA (5 mM), the interaction between hNgR1 and a surface coated with NHS/EDC (without heterohexamers), and an AFM tip with tris-NTA (without hNgR1) and a single-heterohexamers-coated surface. (I) DFS plot showing the distribution of rupture forces as a function of their LR, measured between hNgR1 and single heterohexamers. The solid line represents the Bell–Evans fit (for simple ligand–receptor bond). For contact time plots, data points represent mean BP calculated for each contact time and were fitted using a least-squares fit of a monoexponential decay. For all DFS and contact time plots, the error bars indicate SD. For all BP plots, one data point represents the BP obtained for one map of 1024 FD curves. The horizontal line within the box indicates the median, boundaries of the box indicate the SEM, and the whiskers indicate the SD. All data are representative of at least n = 3 independent experiments. (J) Structural representation of the complex between hNgR1 (in blue surface) and the two σ3A (in light-grey surface) and σ3B (in dark-grey surface) subunits. (K) Root-mean-square deviation (RMSD) of indicated chains computed using hNgR1 as the reference for the MD trajectory alignment. Plots are colored in blue, light grey, and dark grey for hNgR1, σ3A, and σ3B, three MD replicates are shown.

Fig. 2