. 2024 Sep 30;9(11):1925–1937. doi: 10.1039/d4nh00315b

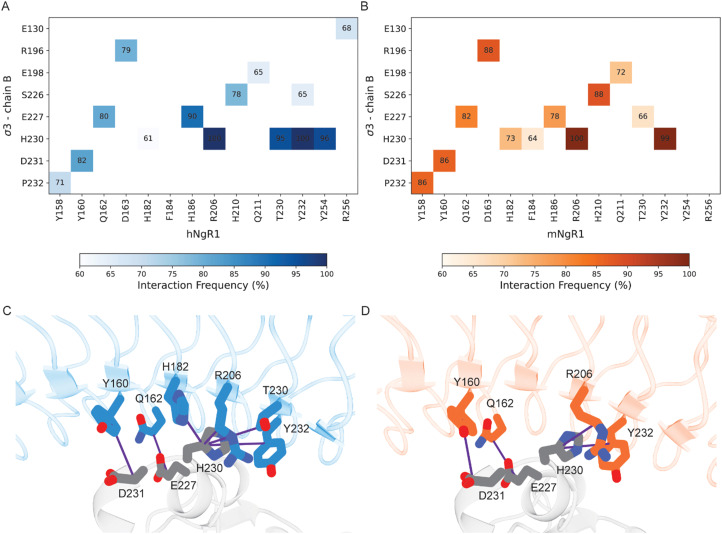
Fig. 4. Residues in common that are involved in the interactions between human and murine NgR1 with σ3B. (A) and (B) Heat maps of interacting residues in the initial complexes that occur frequently in the simulations. Cells of the heat maps are colored according to the increased number of interactions, from white to dark blue for the hNgR1 complex (A) and white to dark orange for the mNgR1 complex (B). (C) and (D) 3D representation of the key interactions established by residues Y160, Q162, and R206 of hNgR1 and mNgR1, and H230 of σ3B. The σ3, hNgR1 (C), and mNgR1 (D) structures are shown in grey, blue, and orange cartoons, respectively. Violet lines indicate the residue connections that are found during the simulations (for the type of interactions, see Table S1, for the complete overview of all contacts see Fig. S8, ESI).

Fig. 4