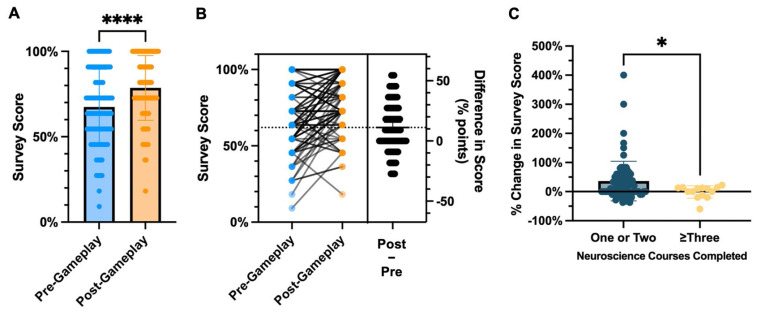
Figure 5.
Student performance on conceptual survey questions. (A) Average population scores on pre- versus post-gameplay knowledge-based questions (p<0.0001, Wilcoxon matched-pairs Test, n=93). (B) Pairwise comparisons of group data from (A) showing differences in post- versus pre-gameplay scores (dashed line = average difference in percentage points of +11.14). (C) Percent change in scores on conceptual questions from post- versus pre-gameplay surveys between introductory (blue, n=79) and advanced (yellow, n=14) neuroscience students (p=0.0256, Mann-Whitney Test).

