Figure 4.

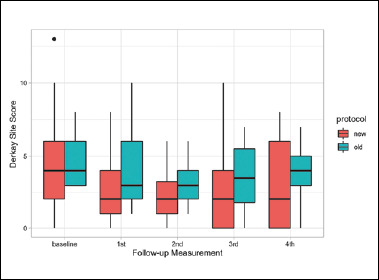
Boxplots representing the Derkay Site Scores for each treatment at sequential time points during the first year of follow-up after the first treatment.

Boxplots representing the Derkay Site Scores for each treatment at sequential time points during the first year of follow-up after the first treatment.