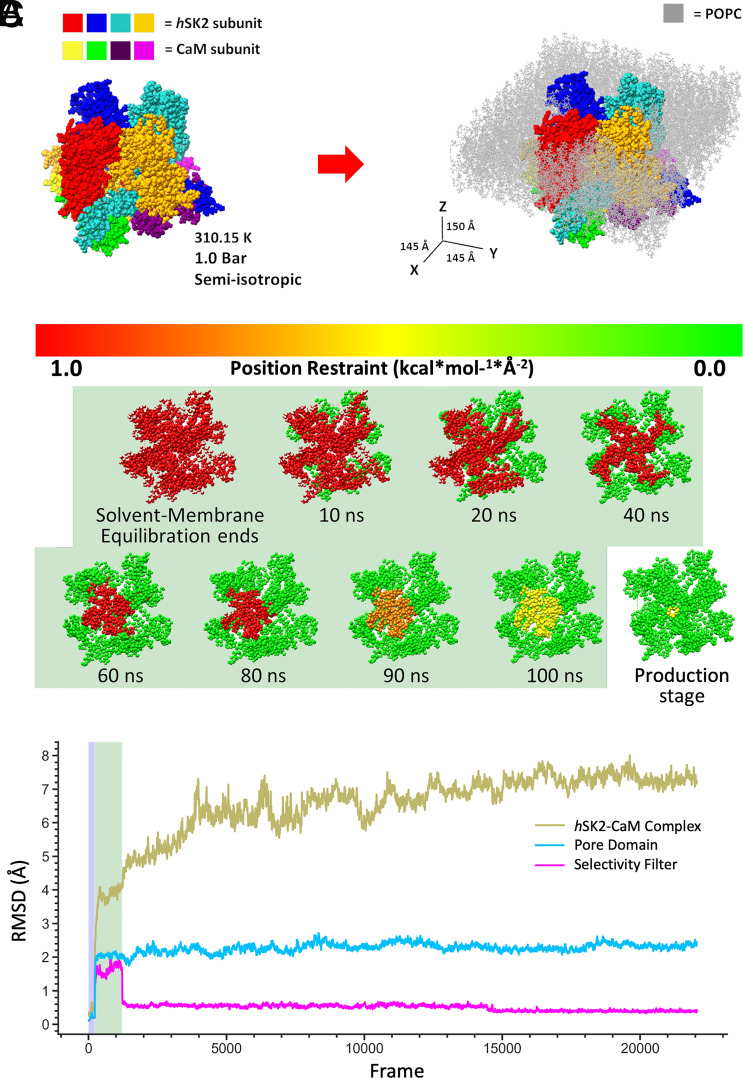
Fig. 3.
MD simulation parameters for a hSK2–CaM complex: (A) Visualization of the four subunits of hSK2–CaM complex before (Left) and after (Right) embedding into a POPC bilayer (light gray). PIP2 molecules are included in the lower bilayer leaflet only but are not visualized. MD simulation conditions and box size dimensions in X, Y, and Z are shown. (B) An extended equilibration protocol for 100 ns using Amber18 on the high-performance computer cluster (HPC) Expanse provides stable MD simulations by varying the location and strength of the restraints applied to the hSK2–CaM tetramer up to each time point indicated in ns and shaded in light green. It was followed by mostly unrestrained production run on Anton 2 supercomputer. (C) RMSD profiles for the backbone Cα hSK2–CaM tetramer and the selectivity filter (SF) during MD simulations equilibrated for 100 ns using Amber18 (light green shaded area corresponding to the shaded area in panel B), followed by production runs of up to 5,000 ns on Anton 2.

