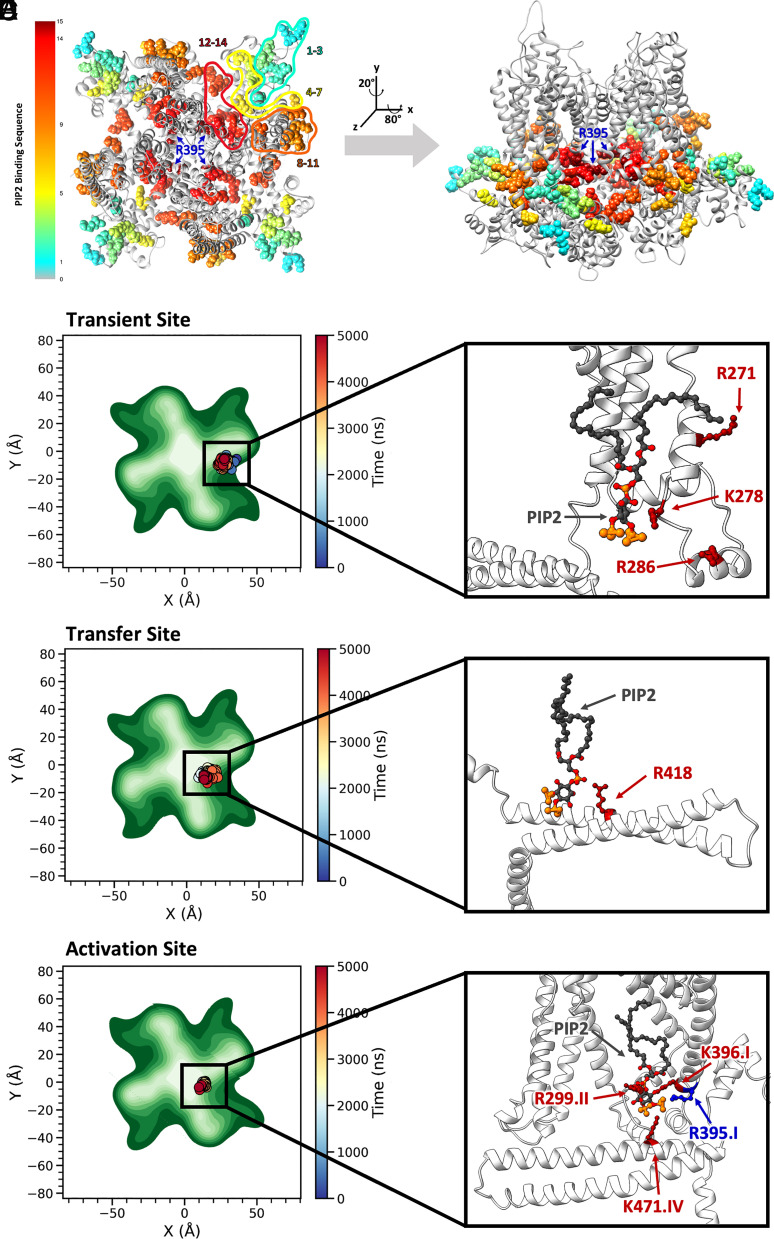
Fig. 5.
Tracking of PIP2 in the membrane XY plane over time identifies two PIP2 binding pockets, denoted transient and activation binding sites. (A and B) Movement of PIP2 molecules into the binding pockets of the hSK2–CaM homology model in the intermediate state during MD simulations. The color scale provides time progression over the 5-μs MD simulations from cyan to green, yellow, orange, red, and dark brown. The hSK2–CaM complex is shown with top (from the extracellular side) and side views in panels A and B, respectively. (C–E, Left Panels) Top views of the hSK2 channel as in A. PIP2 molecule 1, 2, and 3 locations at the transient, transfer, and activation binding sites during 5 μs of the MD simulations. PIP2 location is shown by colored dots corresponding to the simulation time with the corresponding time scale on the right, whereas hSK2–CaM complex atomic density is shown in different shades of green with darker colors corresponding to higher density. (C) PIP2 molecule 1 at the transient binding site, which includes amino acid residues R271, K278, and R286. (D) Transfer of PIP2 molecule 2 from the transient to the activation binding site. (E) PIP2 molecule 3 at the activation binding site, which includes residues R299, R395, K396, and K471. (C–E, Right Panels) Magnified side view of the binding sites of PIP2 on hSK2 channel (side view as in Panel B) to further illustrate amino acid residues crucial for PIP2 binding.

