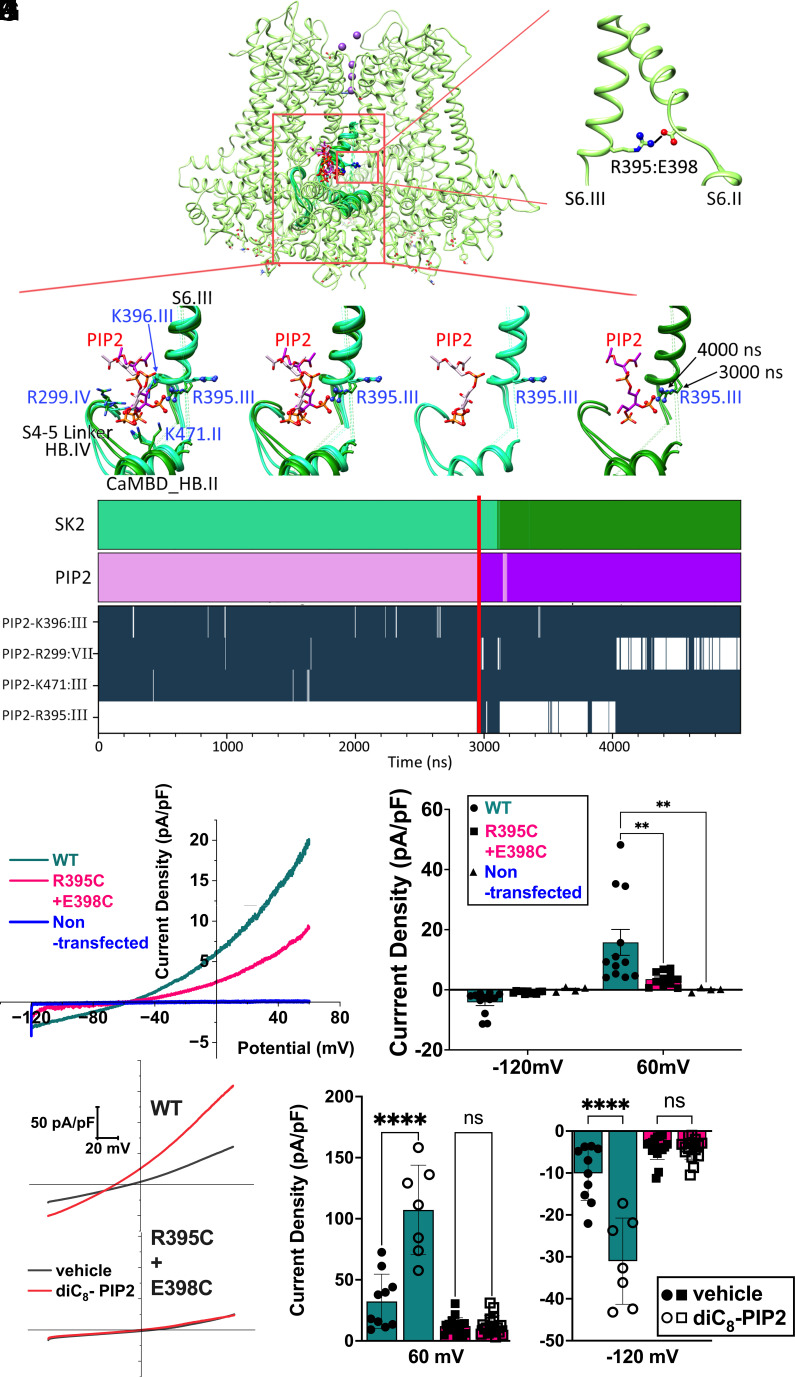
Fig. 6.
Formation of salt bridges between PIP2 and amino acid residues from the hSK2–CaM tetramer and their disruption by mutagenesis experiments. (A) hSK2–CaM complex (shown as green ribbons with 70% transparency) to highlight the location of PIP2 binding shown as a wireframe. Only two subunits are shown for clarity. The red box highlights the region of zoom-in panels in B–F. (B) Zoom-in view of the intersubunit salt bridge between R395 of subunit III and E398 of subunit II located on S6 helices shown as ribbons. (C–F) PIP2 carbon atoms are shown in pink and hSK2 backbone is shown in green. Phosphorus (orange), oxygen (red), and nitrogen (blue) atoms involved in PIP2:R395 salt bridges are shown in ball-and-stick representation. Representative poses of hSK2–CaM from clustering of MD simulation data that are able to form the PIP2:R395 salt bridge are shown in darker shades and poses unable to form this salt bridge are shown in lighter shades. (C) Poses with all major amino acid residues forming salt bridges with PIP2 in the activation site, R299, R395, K396, and K471. (D) R395 side chain orientations shown to exemplify differences when it forms a salt bridge with E398 vs. PIP2. (E) Only hSK2–CaM poses that do not form the PIP2:R395 salt bridge. (F) Only hSK2–CaM poses that do form the PIP2:R395 salt bridge. (G) Two top graphs show clustering of MD simulation results based on simulation time showing hSK2–CaM (SK2) and PIP2 poses, which are able to form the PIP2:R395 salt bridge in darker shades of green and pink, respectively. The four lower graphs show time series of salt bridge formation (dark-blue) and breaking (white) between several hSK2–CaM residues and PIP2 using a 3.6 Å cutoff. The red vertical line across all the graphs shows time point at which R395:PIP2 salt bridge was first detected. (H) Apamin-sensitive currents from hSK2-WT compared to tandem constructs containing R395C and E398C mutations in hSK2 subunits 1 and 2, respectively. Nontransfected HEK293 cells do not exhibit appreciable apamin-sensitive currents under our recording conditions (blue trace). (I) Summary data showing the apamin-sensitive current density at −120 and +60 mV, respectively. (J) Representative current traces showing responses of WT compared to the mutant constructs to diC8-PIP2 in HEK293 cells with diC8-PIP2 (red traces) or vehicle alone (black traces) in the intracellular solution. (K) Summary data demonstrating hSK2 current density from WT compared to the mutant constructs. hSK2-WT current density was significantly enhanced by diC8-PIP2, while the mutant construct failed to respond to PIP2.

