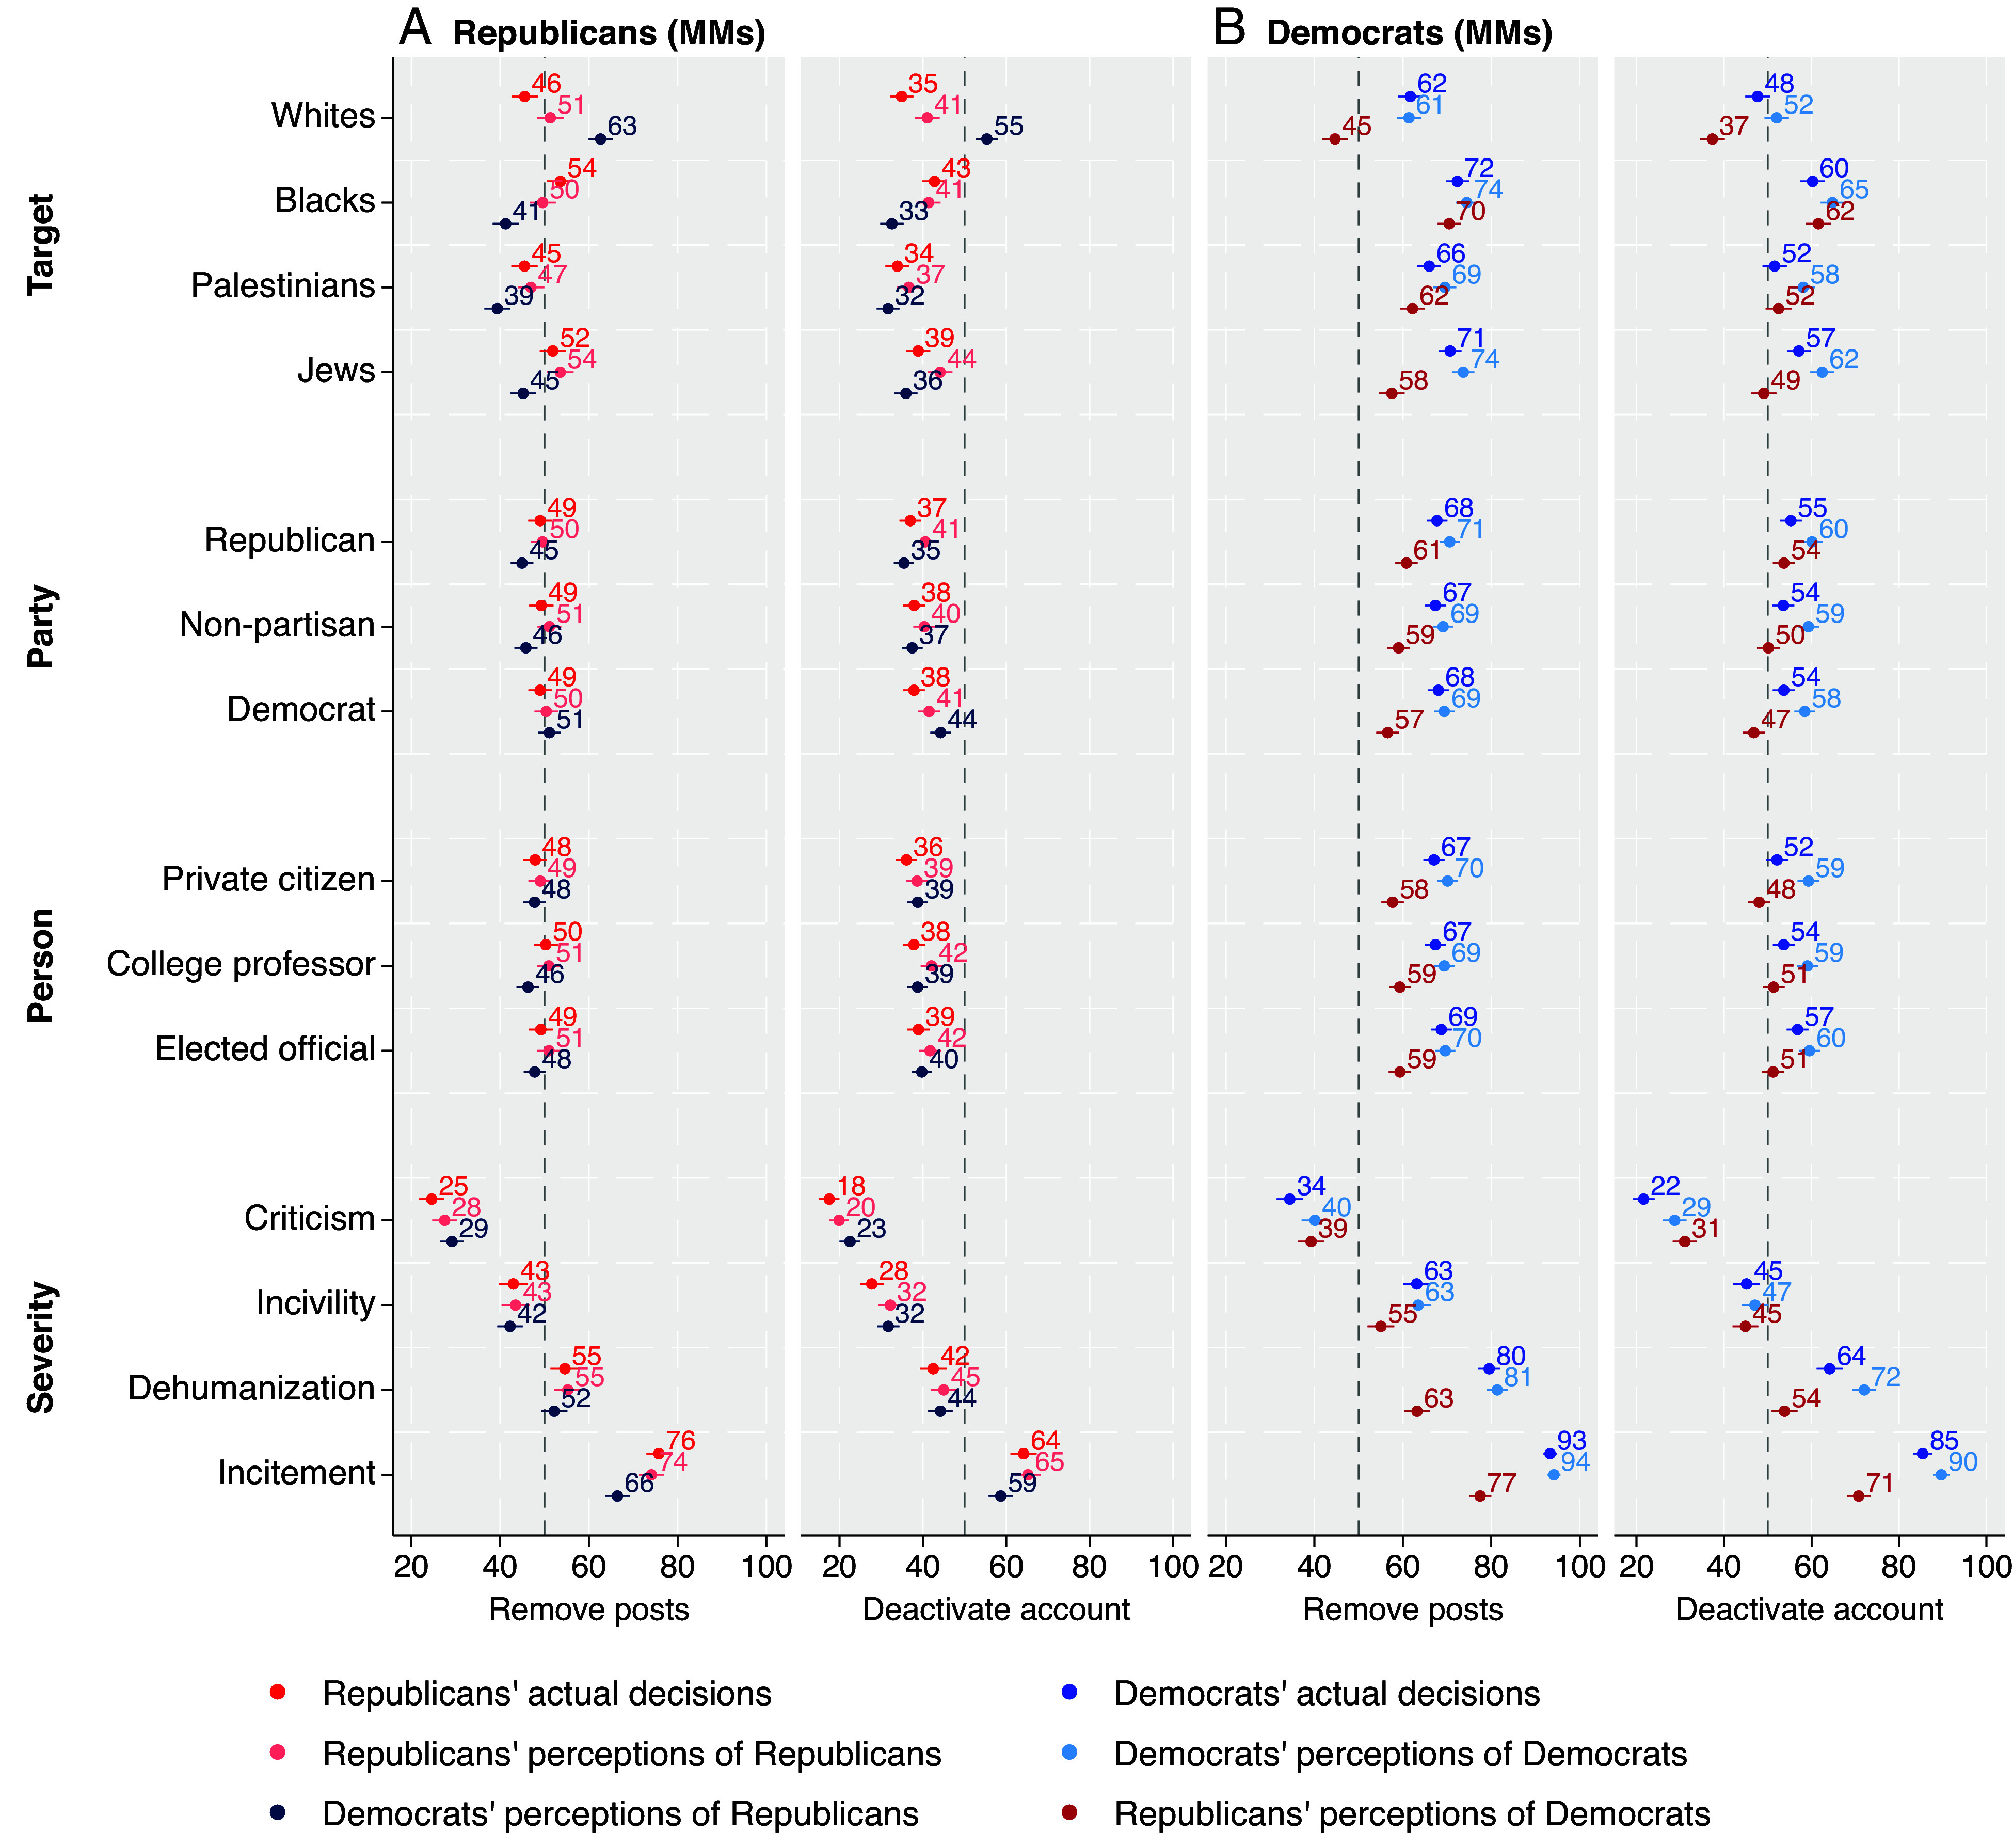
Fig. 3.

Perceived censorship decisions by target group. Figure reports the MMs of actual decisions, in-party perceptions of decisions, and out-party perceptions of decisions regarding removal and deactivation for (A) Republicans and (B) Democrats, plotted with 95% CIs. All values are percentage points.
