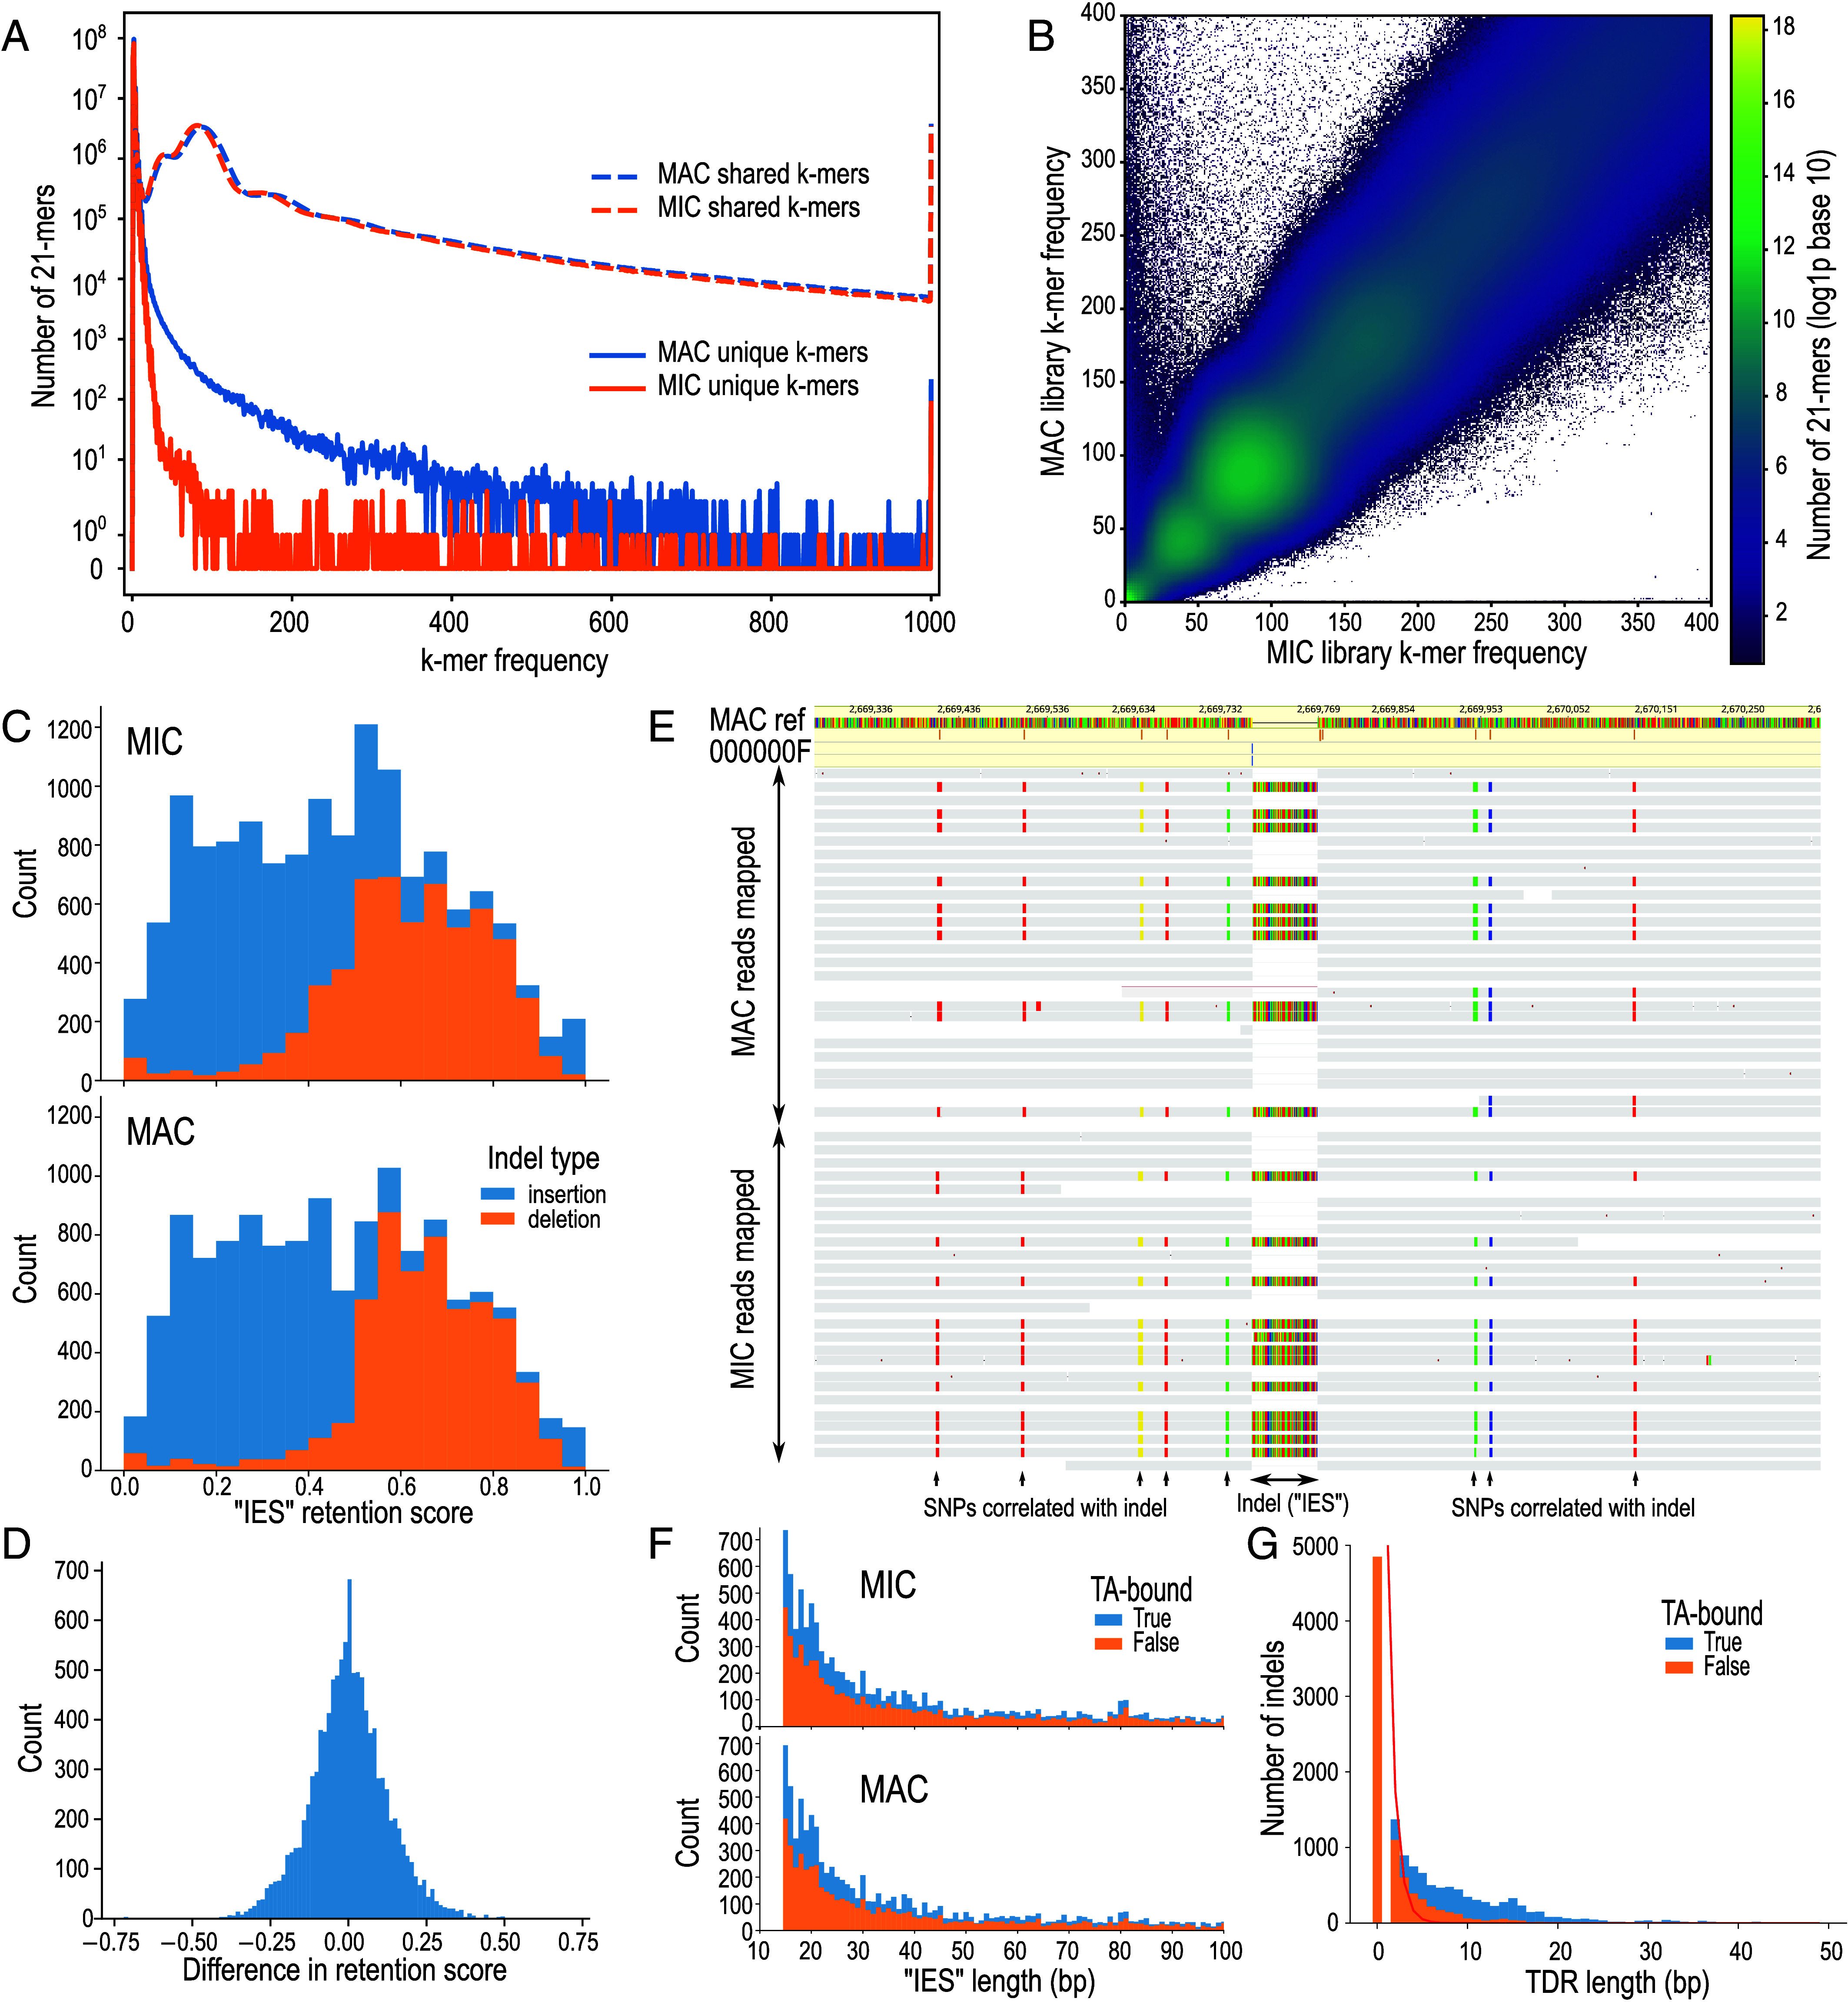
Fig. 2.

Screening for IESs in L. magnus. (A) k-mer multiplicity plot for shared (dashed lines) vs. unique (solid lines) 21-mers in MAC (blue) and MIC (orange) sequence libraries. (B) Heatmap comparing frequency of genomic 21-mers in MIC vs. MAC; color scale represents log (1+number of k-mers); axes truncated at 400× frequency. (C) Histograms of relative coverage (“retention score”) for putative “IESs” (indels) predicted by an IES detection pipeline from MIC and MAC HiFi long-read libraries. (D) Histogram of differences in retention scores between MIC and MAC libraries for putative “IESs.” (E) Example of HiFi long reads (horizontal bars) from MIC and MAC mapped to MAC reference genome (colored bar, Top), containing an “IES” indel correlated with SNPs; colored bases in reads differ from reference. (F) Length histograms of indel polymorphisms; colored by whether they are bound by TA-containing tandem direct repeats (TDRs); x-axis truncated at 100 bp. (G) Lengths of TDRs bounding indel polymorphisms (bars), compared to expected lengths assuming random sequence (red line).
