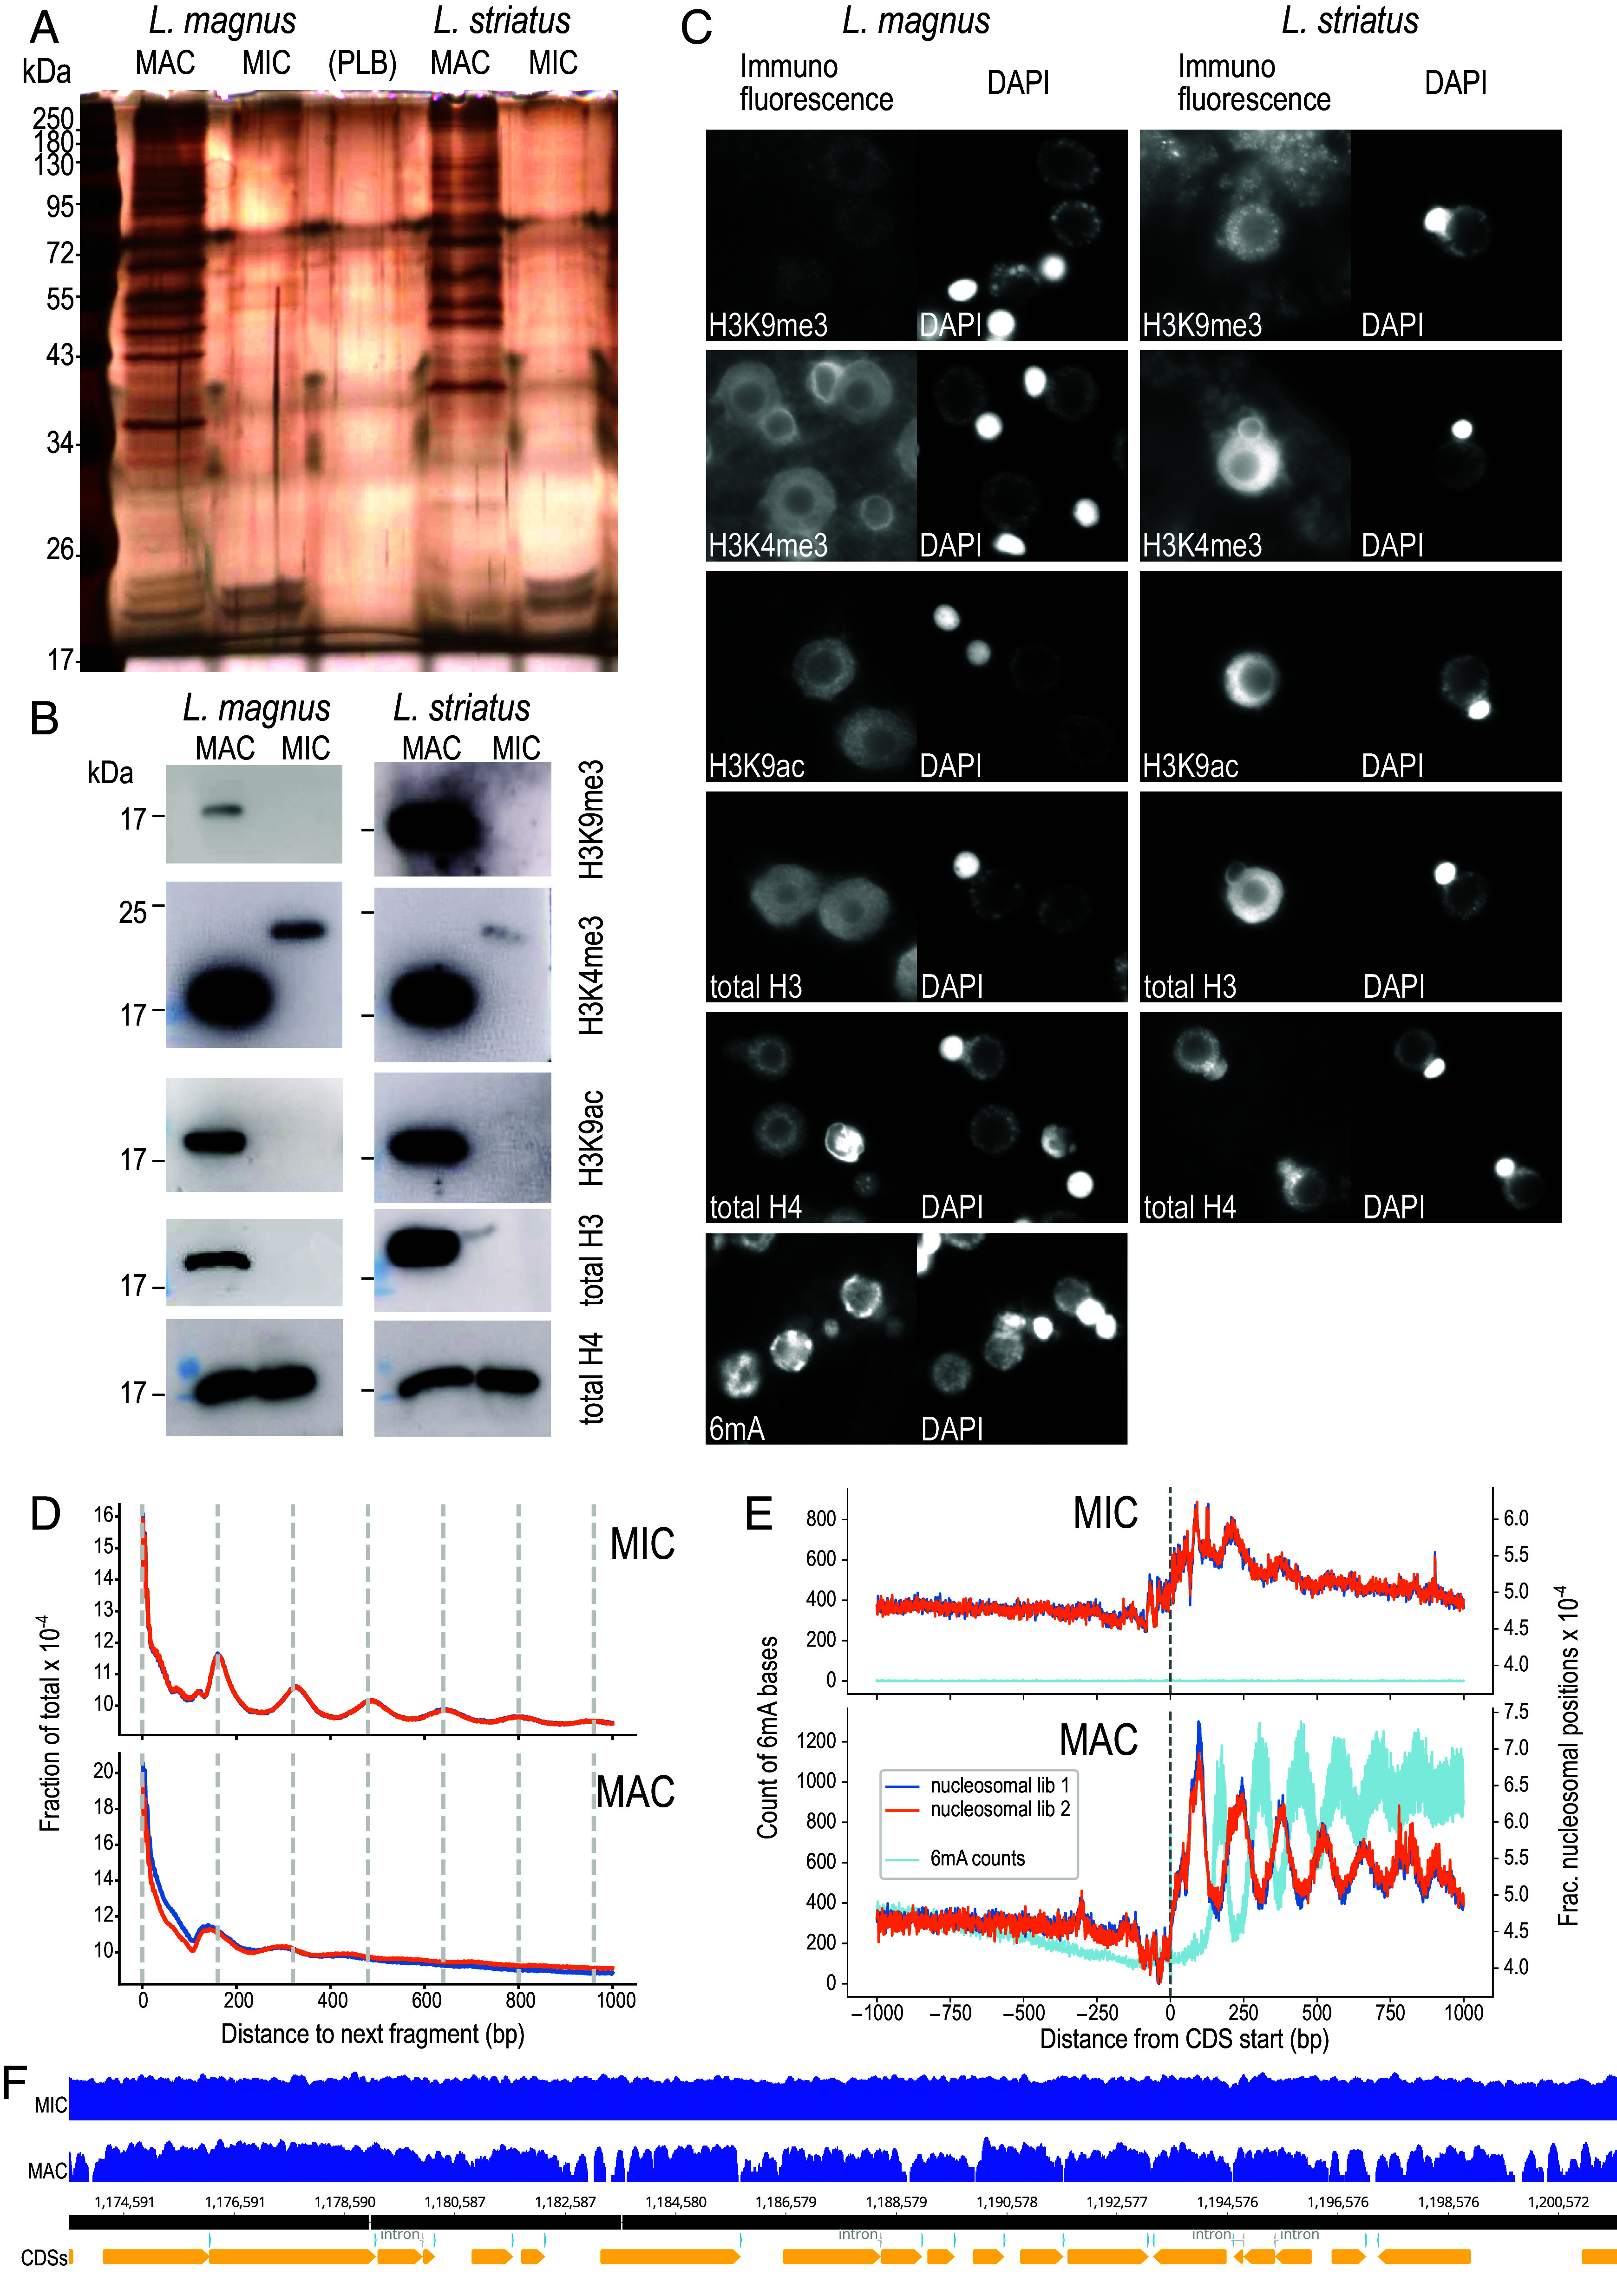
Fig. 5.

Molecular differences between Loxodes MICs and MACs. (A) Silver-stained PAGE gel of protein extracts from flow-sorted nuclei. PLB—protein loading buffer only. (B) Western blots against histone modifications in flow-sorted nuclei. (C) Secondary immunofluorescence in fixed cells against histone modifications or 6mA, alongside DAPI staining of DNA. Panel widths: 30 µm. (D) Global phaseograms of nucleosomal DNA density (two replicates: dark blue, orange lines) in flow-sorted L. magnus nuclei (low complexity repeats masked); vertical lines—160 bp intervals. (E) Phaseograms of nucleosomal DNA density (two replicates: dark blue, orange lines) and 6mA modified bases (light blue) relative to predicted coding sequence start positions in flow-sorted L. magnus nuclei. (F) Example coverage pileups (log scaled) for L. magnus MIC vs. MAC nucleosomal DNA reads mapped to MAC assembly (contig 000000F), aligned with CDS predictions (Bottom track).
