
Fig. 5.
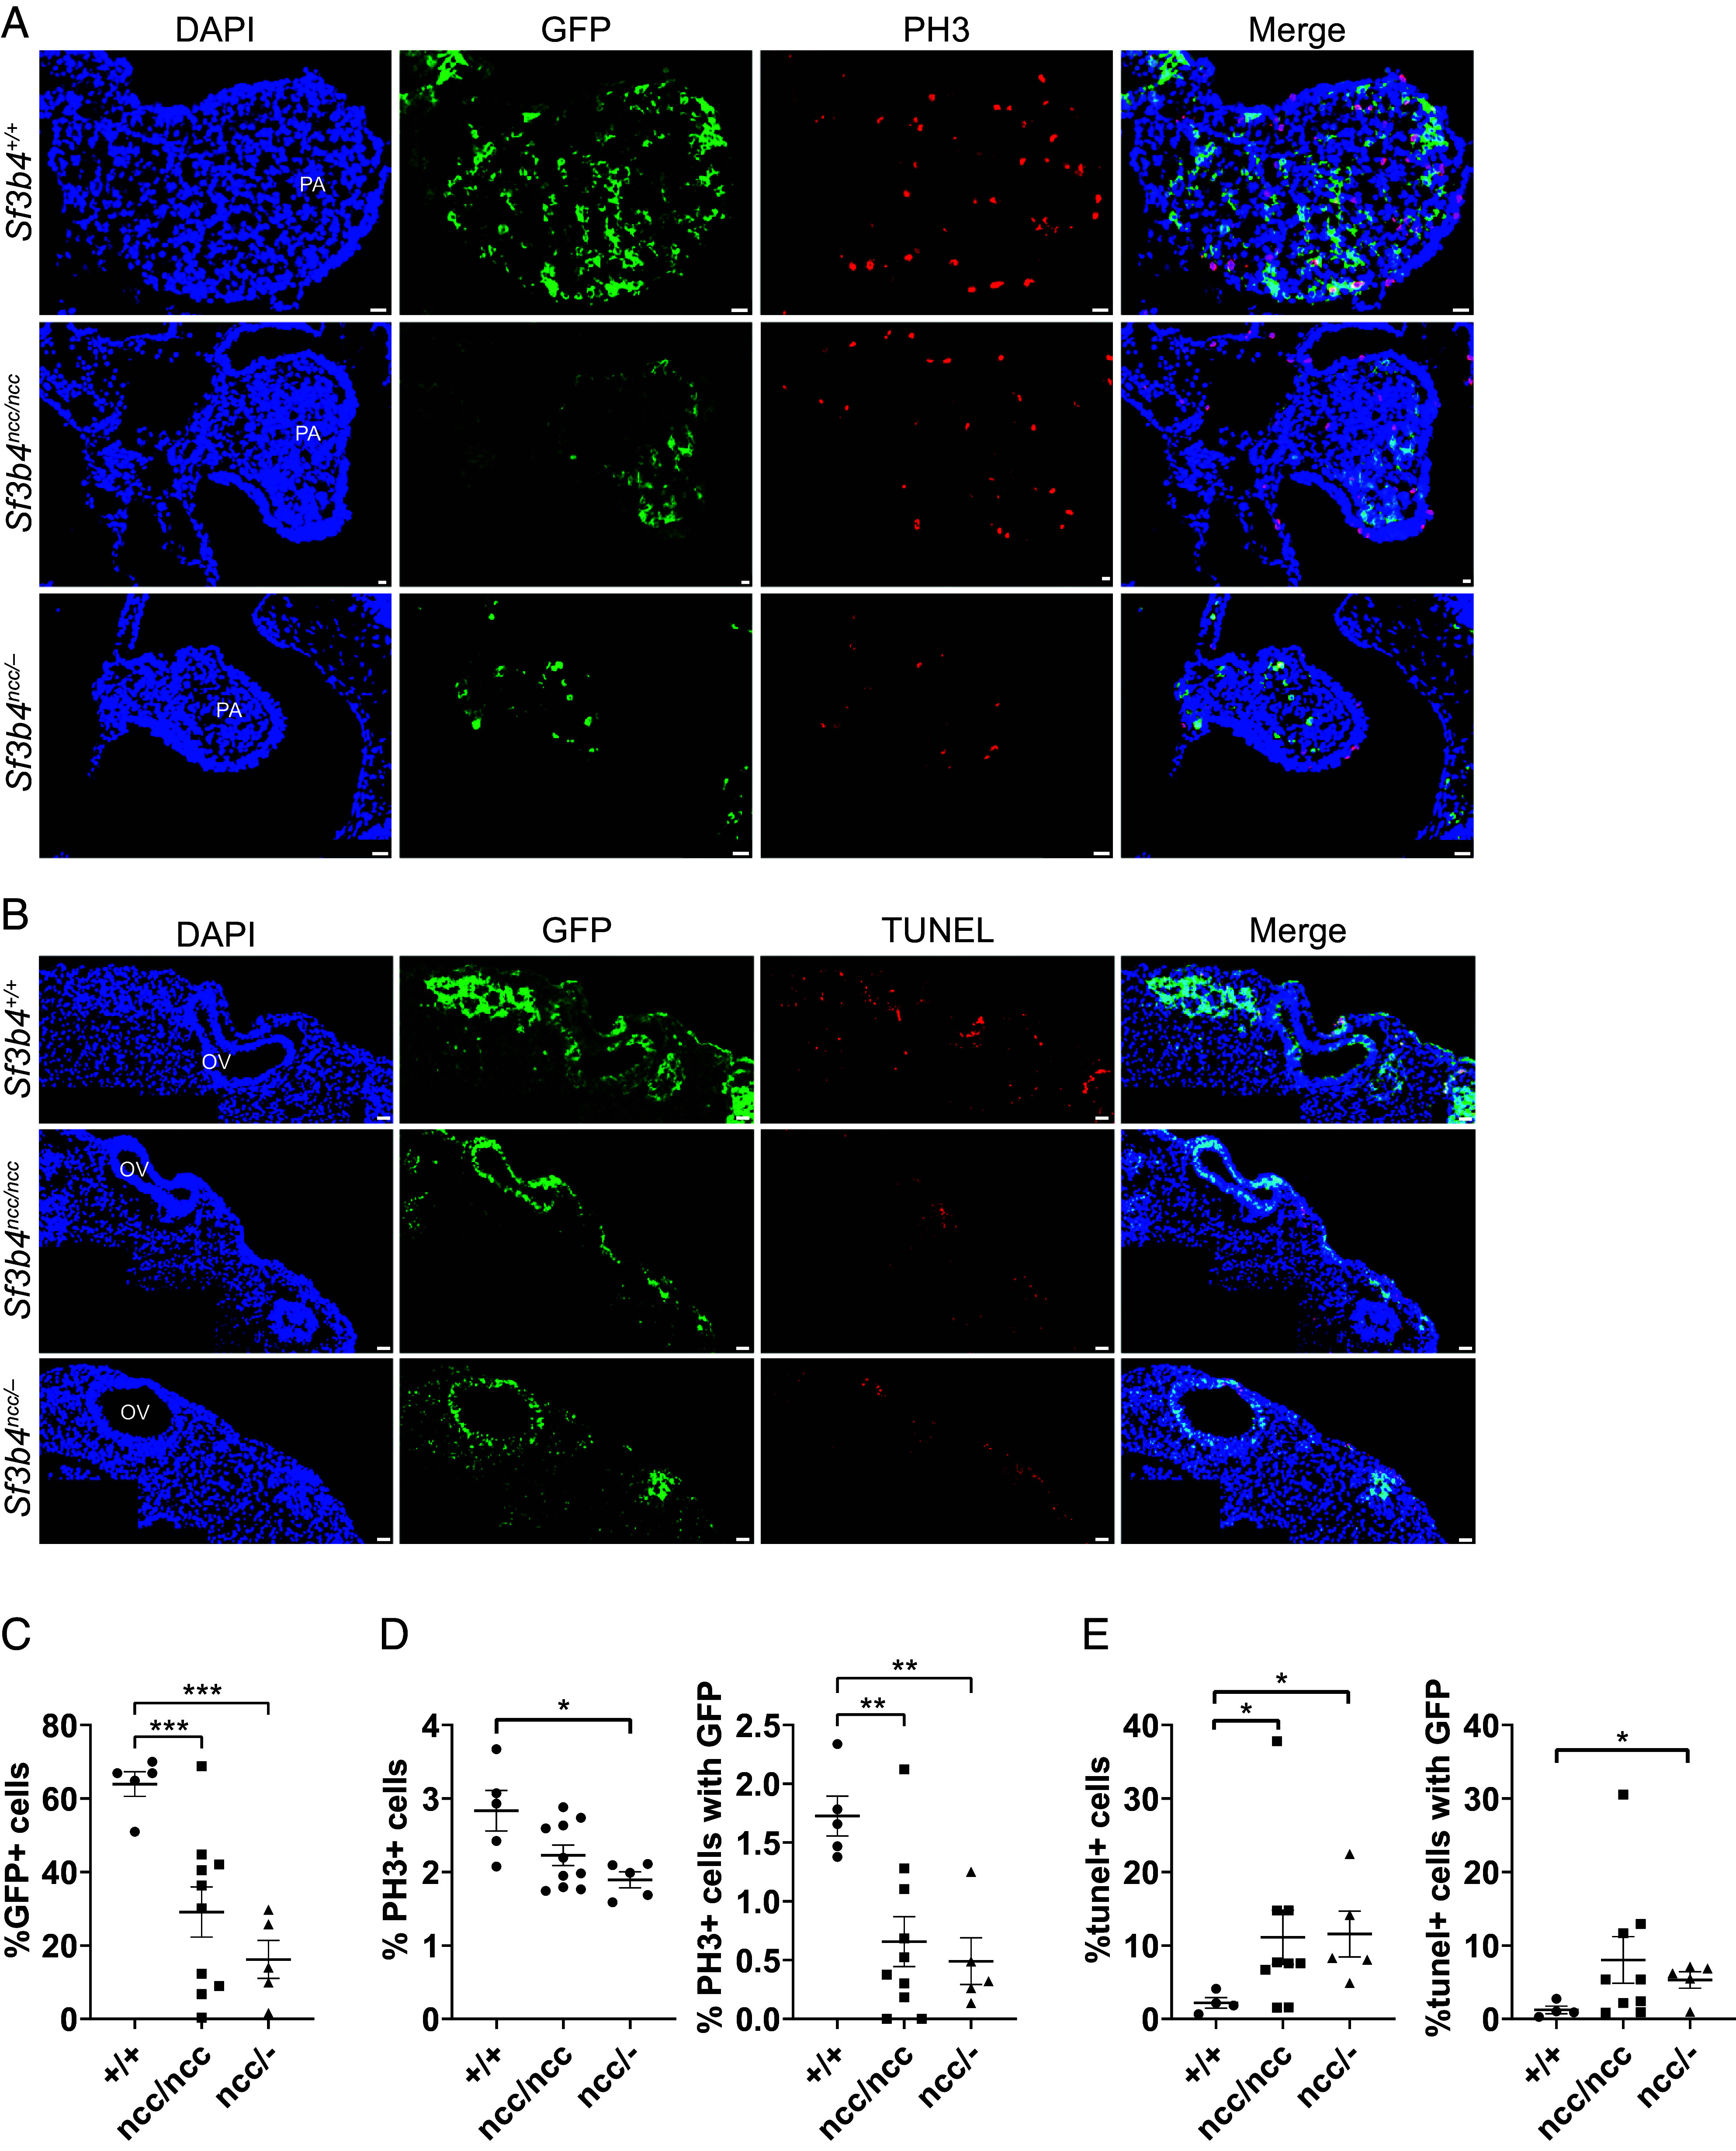
NCCs with Sf3b4 mutations have decreased proliferation and increased cell death. (A) Representative images of first pharyngeal arch sections of wild type and mutant embryos stained with PH3 to look at proliferation. PA; pharyngeal arch. (Scale bar, 20 μm.) (B) Representative images of TUNEL assay on sections of hindbrain with otic vesicle in wild type and mutant embryos. OV; otic vesicle. (Scale bar, 20 μm.) (C) Quantification of GFP expression in the first PA at E9.5 with a significant decrease in Sf3b4 mutants. Each data point represents the average of four sections from one embryo, error bars are ±SEM, ***P < 0.001. (D) Graph showing quantification of PH3+ cells in the pharyngeal arch with a significant decrease in the mutants. Each data point represents the average of four sections from one embryo, error bars are ±SEM, *P < 0.05, **P < 0.005. (E) Graph showing quantification of TUNEL+ cells in the hindbrain and otic vesicle region with a significant increase in the mutants. Each data point represents the average of 3/4 sections from one embryo, error bars are ±SEM, *P < 0.05, **P < 0.005.